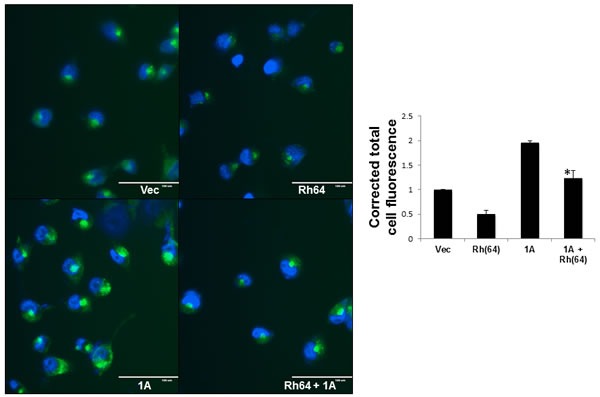
Figure 5. RASSF1A blocks Rheb suppression of autophagy.

The NCI-H1299 cell matched set described in Figure 2 were grown on 35mm dishes to ~60% confluency and nuclei were stained with Cyto-ID detection dye and Hoechst 33342 stain. The stained cells were observed under fluorescent microscope. Scale bar indicates 100μm. (right) Corrected total cell fluorescence (CTCF) of a minimum of 50 cells per treatment was calculated using imageJ software, and the results of three independent experiments plotted as a bar graph. Data is expressed as corrected total cell fluorescence [CTCF = Integrated density - (Area of total cell x mean fluorescence of background)] normalized to vector control cells. Values that are significantly different are indicated by an asterisk as follows: *, P < 0.05 compared to the value for Rh(64) cells.
