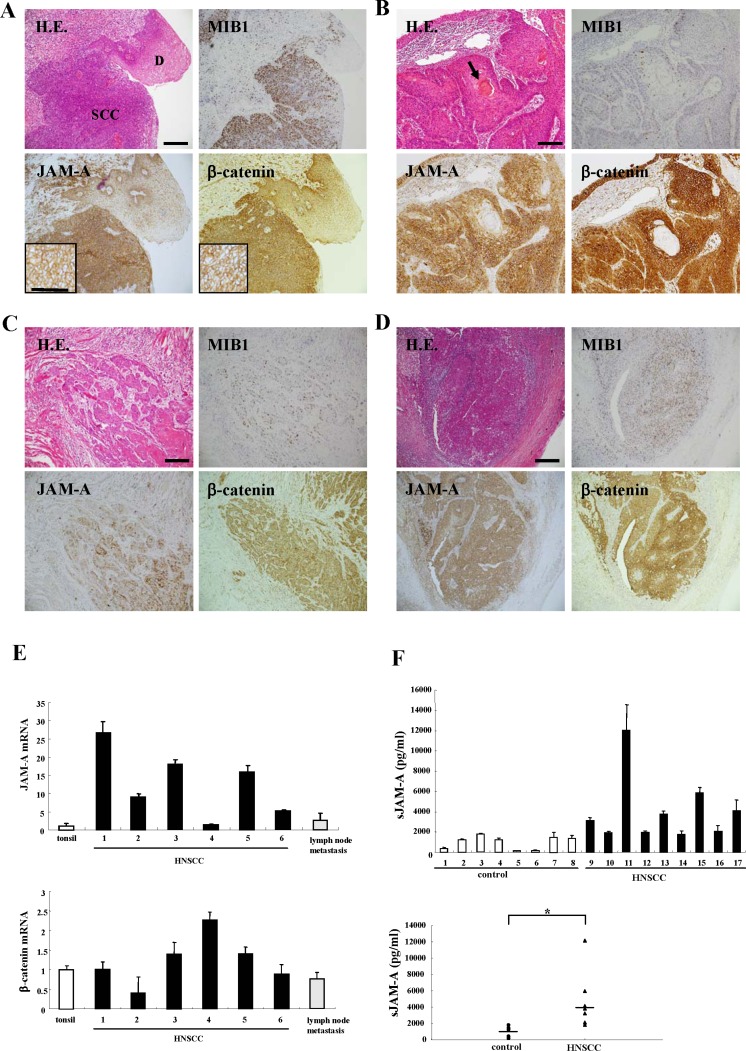
Figure 1. Images of H.E. and immunohistochemical staining of MIB1, JAM-A and β-catenin in tissues of HNSCC patients and dysplastic regions.
(A) HNSCC and dysplasia, (B) cancer pearl region, (C) invasive region, (D) metastatic lymph node. Bar: 100 μm. (E) Real-time PCR for mRNAs of JAM-A and β-catenin in tonsil and HNSCC-patient tissues. Results are given as means ± SE. (F) ELISA for soluble JAM-A in sera of HNSCC patients and healthy control subjects. Results are given as means ±SE. (F) p* < 0.01.

