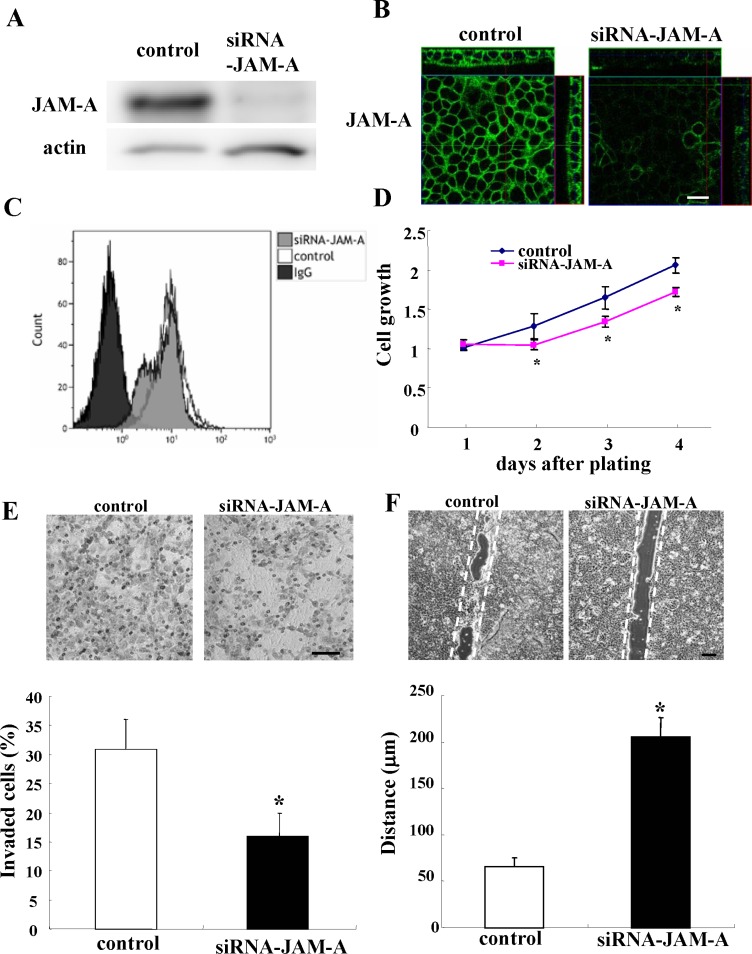
Figure 2. Western blotting (A) immunocytochemical staining (B) and flow cytometry (C) for JAM-A in Detroit562 cells transfected with negative control siRNA or JAM-A siRNA.
Proliferation assay (D) Matrigel invasion assay (E) and images of scratch wound assay (F) of Detroit562 cells transfected with negative control siRNA or JAM-A siRNA. Bars: 100 μm. The results are shown as bar graphs. (D, E, F) p* < 0.01.

