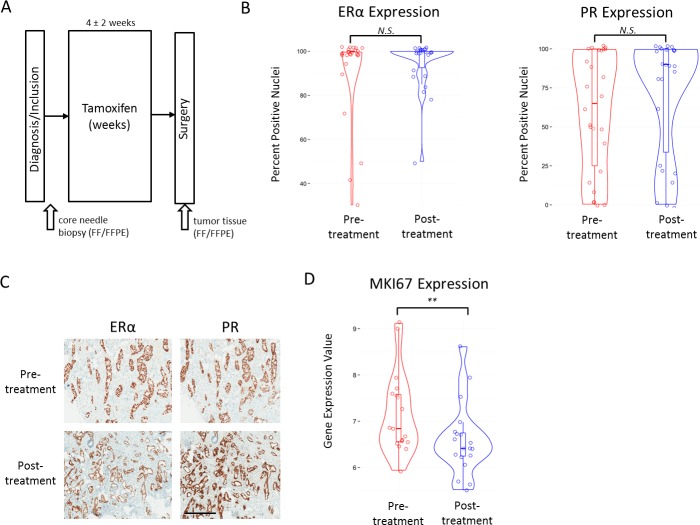
Figure 1. Study collection and clinical marker values.
A., Schematic representation of the AFTER study patient and material collection. B., Violin plots with boxplot overlay of IHC scores (Y-axis) for ERα (left panel) and PR (right panel) in pre- and post-treatment samples. N.S. indicates a p-value that is not significant at 0.05 level. C., Example of IHC staining of ERα and PR in a pre- and post-treatment sample. Black bar indicates 400μm. D., Violin plots with boxplot overlay of MKI67 gene expression values in pre- and post-treatment samples. ** indicates P < 0.01.

