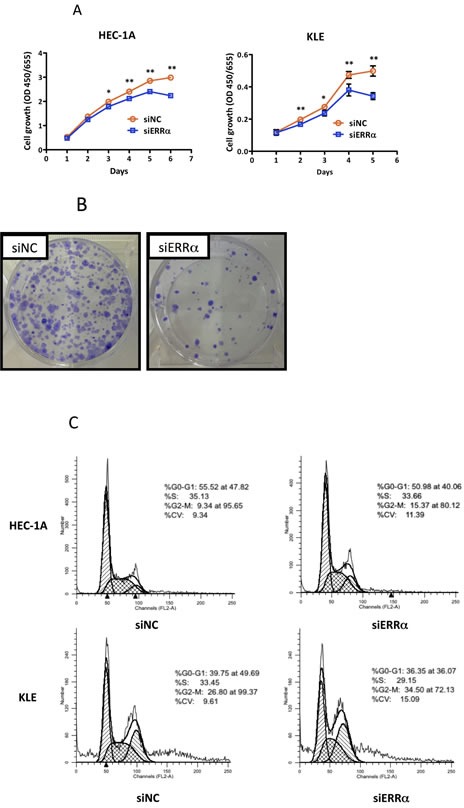
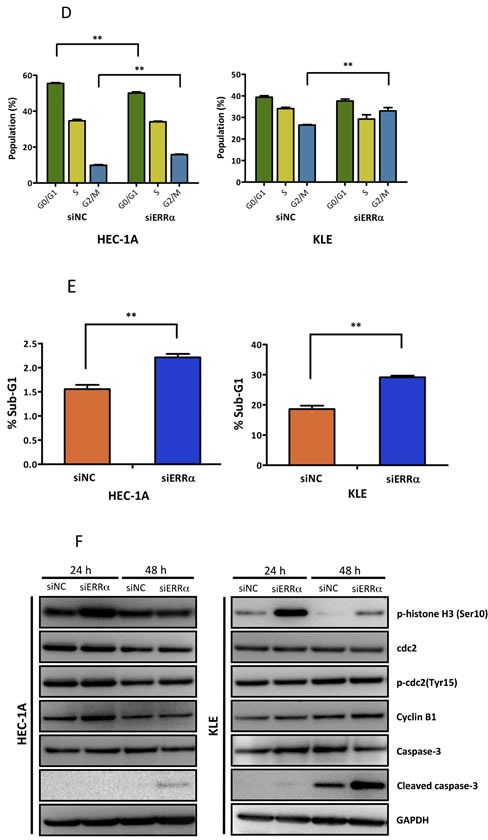
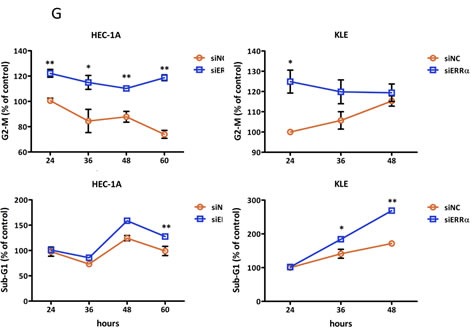
Figure 3. Effect of ERRα knockdown on the proliferation of endometrial cancer cells.


A., WST-8 cell proliferation assay. After siRNA transfection, the viability of cancer cells was determined every 24 h. Data represent means ± SEM (n = 4). B., Colony formation assay. Twenty-four hours after siRNA transfection, cancer cells were reseeded at a density of 3 3200 cells/well in 6-well plates and cultured for 14 days. Cells were then stained with crystal violet. C., Cell cycle analysis using flow cytometry. Twenty-four to 60 h after siRNA transfection, cancer cells were collected and flow cytometry analysis was performed. D., Cell distribution in each phase of the cell cycle. Data represent means ± SEM (n = 3). E., Sub-G1 population. Data represent means ± SEM (n = 3). F., Western blot analysis of proteins involved in the G2/M phase and apoptosis. Twenty-four to 48 h after siRNA transfection, western blotting analysis for phospho-histone H3 (Ser10), CDC2, phospho-CDC2 (Tyr15), cyclin B1, and cleaved caspase-3 was performed using cell lysates. GAPDH was used as a loading control. G., Time-course analysis of the percentage of cells in G2/M and sub-G1 phases. Data represent means ± SEM (n = 3). Significant differences are indicated as ** for P < 0.01 and * for P < 0.05. Each assay was repeated at least three times. siNC, negative control siRNA; siERRα, ERRα siRNA.
