
Figure 5. Effect of ERRα knockdown on proliferation and angiogenesis of endometrial cancer cells in vivo using a mouse xenograft model.
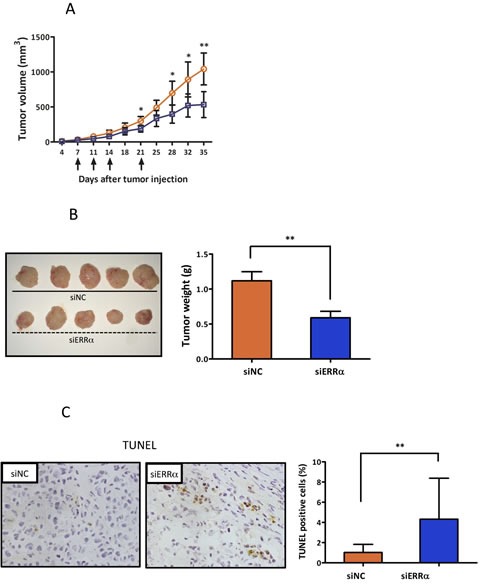
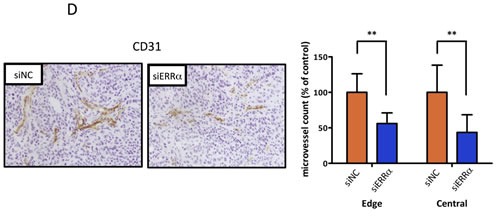
A., In vivo tumor growth analysis. HEC-1A cells (5 × 10⁶ cells per mouse) were inoculated into the back of the mice by subcutaneous injection. Mice were then locally injected with 1000 pmol of either the control (blue box) or ERRα siRNA (orange circle) at the indicated days (arrows). The tumor volumes were measured twice a week. Data represent means ± SD (n = 5). B., Images and weights of excised tumors from each group. C., Apoptotic cells in the tumor sections were detected by TUNEL. The apoptotic index was defined as the percentage of immunopositive cells in 10 high-power fields (× 400). Data represent means ± SD. D., Microvessels were labeled with an anti-CD31 antibody. Microvessels in the densestareas were selected under a low power field (× 40). CD31 immunopositive pixels per microscopic field were counted under a high-power objective (× 200) using ImageJ software. Microvessel density was defined as the percentage of CD31 immunopositive pixels per high-power field (× 200) in 10 different views, and compared in both central and edge areas of the tumor. Data represent means ± SD. Significant differences are indicated as ** for P < 0.01 and * for P < 0.05. siNC, negative control siRNA; siERRα, ERRα siRNA; TUNEL, terminal deoxynucleotidyl transferase-mediated dUTP nick end labeling.