
Figure 2. HALNP uptake rate and extent in glioblastoma, astrocytes and microglial cells.
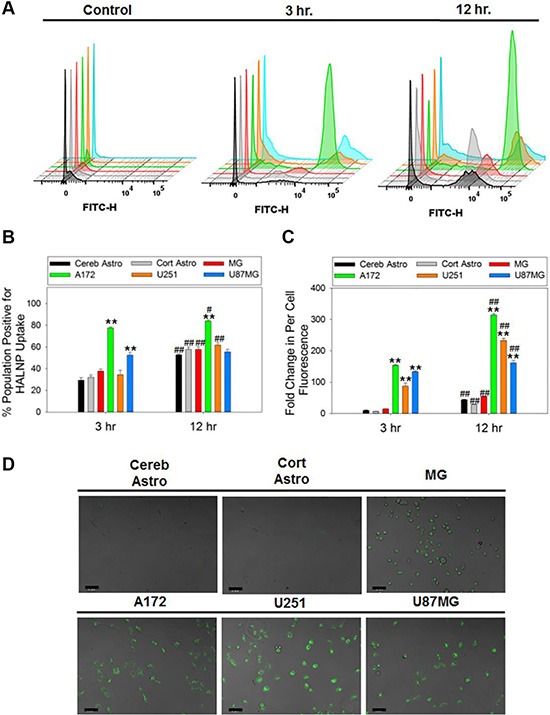
Flow cytometry was employed to measure HALNP uptake via (A) histogram, (B) population wide, and (C) per-cell fluorescence following a 3 and 12 hour incubation time in cerebellum astrocytes (Cereb Astro), cortical astrocytes (Cort Astro), microglial (MG), and three glioblastoma cell lines (A172, U251, and U87MG) (**p < 0.005, *p < 0.05 relative to both astrocytes and MG at the same time point; ##p < 0.005, #p < 0.05 relative to the same cell type at the previous time point; n = 4). For each cell type, control cells (no HALNPs) were used to create a lower limit-gating event to remove cell specific auto-fluorescence. (D) Quantitative confocal microscopy was also performed following an analogous three hours incubation time with HALNPs to validate the flow uptake data. The confocal scale bars at 50 micron.