
Figure 5. Investigation of HALNP intracellular fate in healthy glial versus GBM cells.
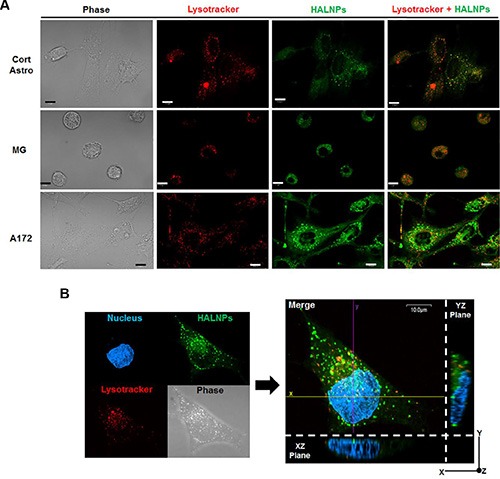
(A) Live cell confocal microscopy with z-axis stacking to probe the HALNP (green) and lysosome (red) co-localization patterns (overlay color = orange). (B) Z-axis transformation analysis with optical zoom to validate lysosomal evasion and subsequent achievement of homogenous cytoplasmic distribution in the A172 GBM cell. The cell nucleus was used as an internal reference point (The XZ and YZ planes show the cell height and width, and height and length respectively). For both confocal analyses a five hour incubation time was implemented and the scale bar is 10 micron.