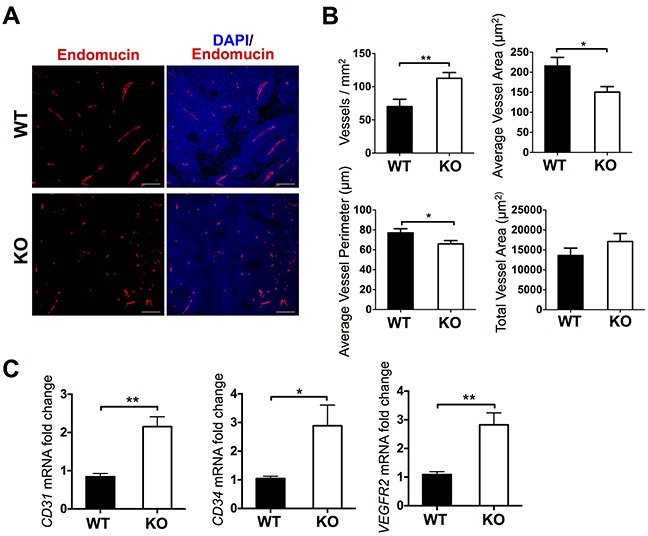
Figure 2. Characterization of vasculature in tumors from WT and ATS1-KO mice.

A. Fluorescence microscopy images of representative sections showing Endomucin and DAPI staining. B. Graphs representing results from the morphometric analyses of vasculature (Metamorph 7 software). These analyses include vessel density (vessels/mm2), average vessel area (μm2), average vessel perimeter (μm), and total vessel area (μm2). Bars show mean values ± SEM. Statistical analyses show unpaired t test. C. Graphs representing gene expression evaluation of vascular-related genes. Bars show mean values ± SEM. (*, p < 0.05; **, p < 0.01).
