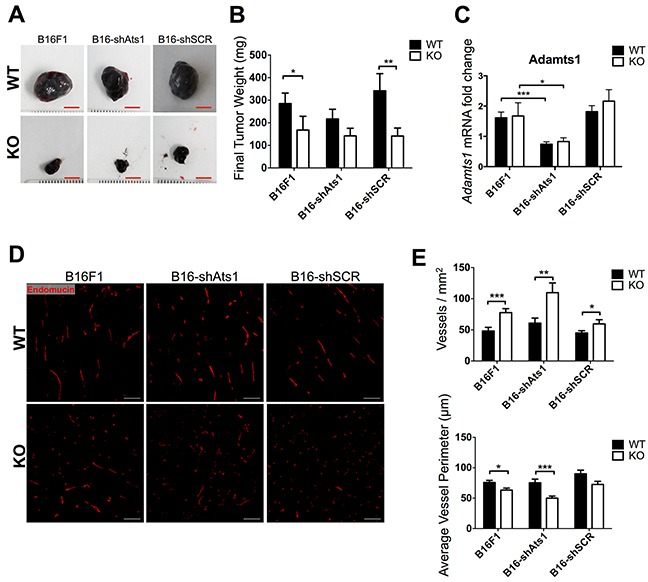
Figure 4. Tumor growth and characterization of vasculature of tumors derived from control and modified B16F1 cells in WT and ATS1-KO mice.

A. Images of representative tumors obtained from different mouse groups after 18 days post-injection (Scale bar= 5 mm). B. Graph representing mean tumor weight ± SEM after 18 days post-injection. (Number of animals in this experiment: WT/B16F1, n=17; ATS1-KO/B16F1, n=14; WT/B16-shAts1, n=10; ATS1-KO/B16 shAts1, n=10; WT/B16-shSCR, n=7; ATS1-KO/B16-shSCR, n=7). C. Graph representing Adamts1 gene expression in the generated tumors. D. Fluorescence microscopy images showing Endomucin staining of tumor sections. Scale bar = 200 μm. E. Graphs representing results from the morphometric analyses of vasculature showing vessel density and average vessel perimeter. Bars show mean values ± SEM. Statistical analyses show unpaired Student's t test. (*, p < 0.05; **, p < 0.01; ***, p < 0.001).
