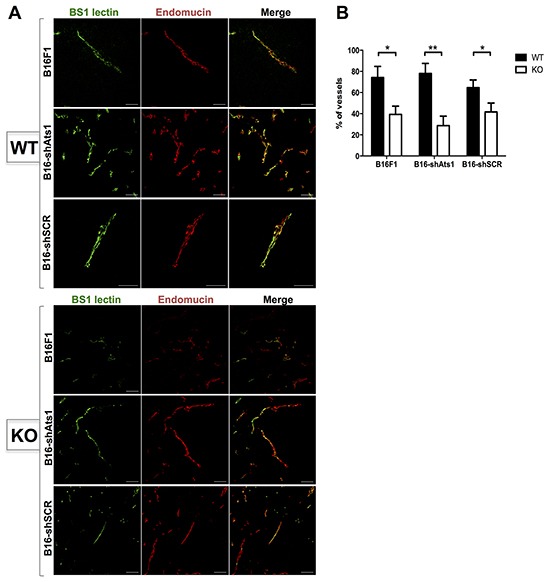
Figure 5. Evaluation of functionality of vasculature of tumors derived from control and modified B16F1 cells in WT and ATS1-KO mice.

A. Fluorescence microscopy images of tumor sections from different mouse groups, showing positive signal of Bs1 lectin (green), Endomucin immunostaining (red), and merge. B. Graph representing the quantification (in percentage) of the number of vessels that showed a colocalization of Bs1 lectin and Endomucin signals within each tumor sections. (Number of animals in this experiment: WT/B16F1, n=4; ATS1-KO/B16F1, n=4; WT/B16-shAts1, n=7; ATS1-KO/B16 shAts1, n=10; WT/B16-shSCR, n=6; ATS1-KO/B16-shSCR, n=8). Bars show mean values ± SEM. Statistical analyses show unpaired Student's t test. (*, p < 0.05; **, p < 0.01).
