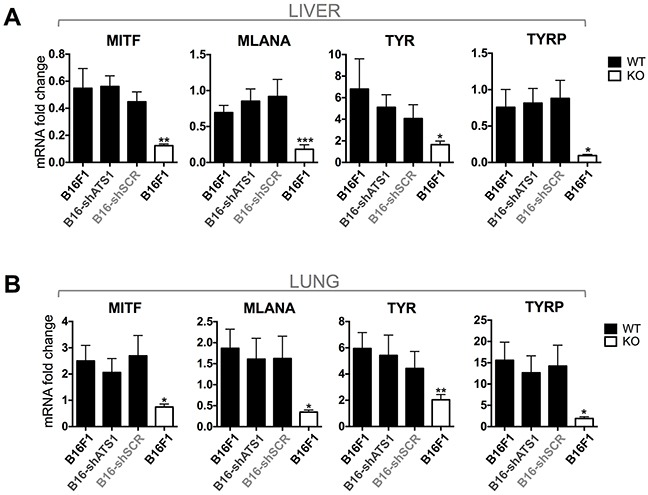
Figure 6. Gene expression analysis of melanoma markers (MITF, MLANA, TYR, TYRP).

A. Graphs representing gene expression of the indicated genes in liver of WT and ATS1-KO mice. Animals were previously injected with control and modified B16F1 cells. In the case of WT mice (black bars), they were intravenously injected with non-modified cells (B16F1) (n=6), interfered shATS1 cells (B16-shATS1) (n=7), and scramble control cells (B16-shSCR) (n=5). Additionally, ATS1-KO mice (white bars) were injected with non-modified B16F1 cells (n=6). B. Graphs representing gene expression of the indicated genes in lung of WT and ATS1-KO mice. Groups are as specified for panel A. Bars show mean values ± SEM (*, p < 0.05; **, p < 0.01; ***, p < 0.001).
