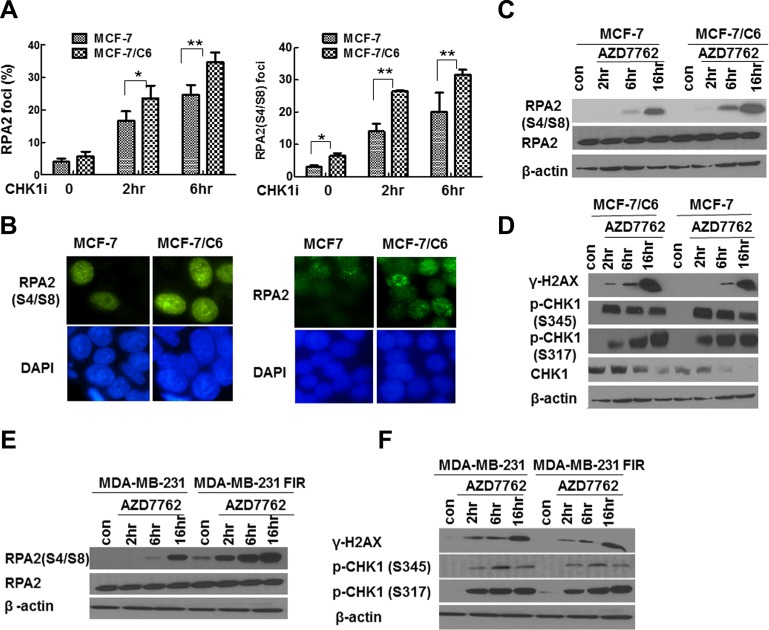
Figure 3. CHK1 inhibition led to the more significant increase in RS in RBCC.
(A) Increased proportion of cells with foci of RPA2 or phosphorylated RPA2 (RPA2 S4/S8) in MCF-7/C6 cells. Data shown are averages from three independent experiments. Error bars represent the SD of three independent experiments (T-test, *p < 0.05, **p < 0.01). (B) Representative foci of RPA2 (left panel) and RPA2 S4/S8 (right panel) are indicated. (C) Expression of RPA2 S4/S8. β-actin or RPA2 are used as loading controls (bottom row). (D) Accumulation of DSBs in MCF-7/C6 cells. The measurement of γ-H2AX by immunoblotting using an antibody raised against ser139 phosphorylated of H2AX. The inhibition of CHK1 activity was monitored by the measurement of p-CHK1-345 and p-CHK1-317. (E–F) CHK1 inhibition led to the more significant increase in RPA2 S4/S8 and there is a space γ-H2AX in MDA-MB-231 FIR cells, compared to control cells.

