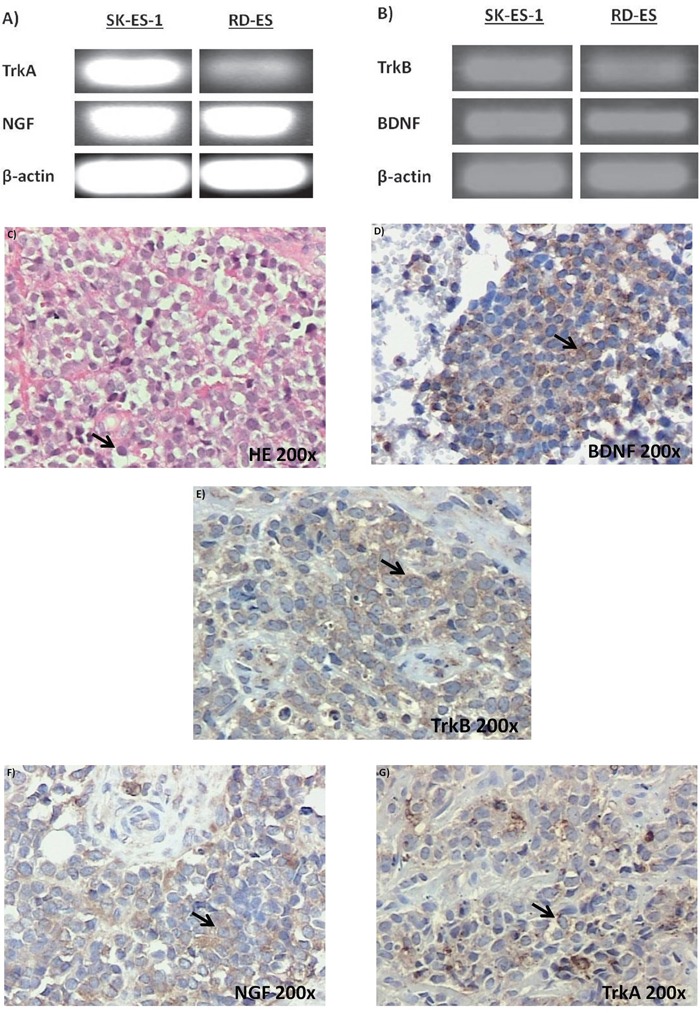
Figure 1. Neurotrophin and Trk mRNA expression in cell lines and protein content in tumor samples.

A. and B. Expression of NGF/TrkA and BDNF/TrkB mRNA transcripts in both examined ES cell lines, RD-ES and SK-ES-1. C. Representative example of HE-stained section of ES tumor sample demonstrating the small round blue cells that are characteristic of this tumor. D-G. Representative photomicrographs of ES sections immunolabeled for BDNF, TrkB, NGF, and TrkA, respectively. Arrows indicate labelled cells.
