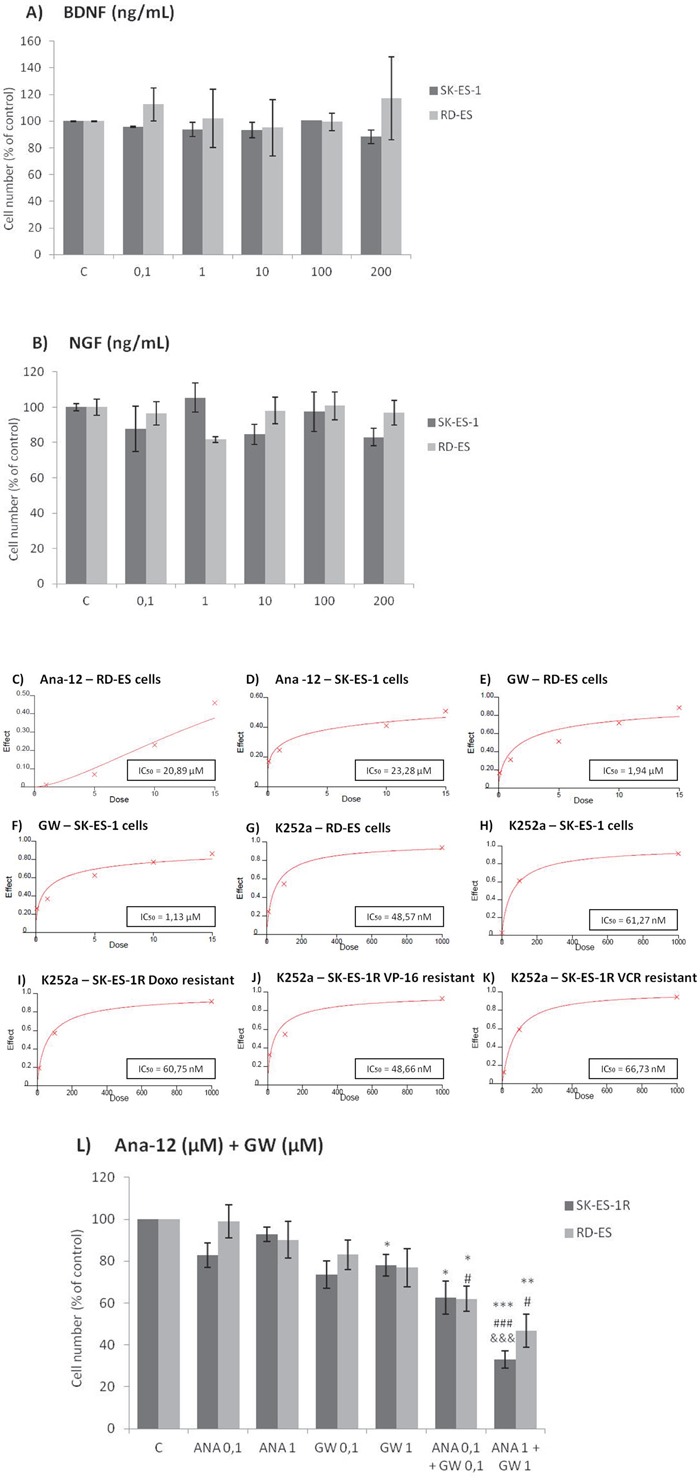
Figure 2. Inhibition of TrkA or TrkB reduces ES cell proliferation.

A, B. Cell proliferation after 72-h treatment with BDNF or NGF (0.1, 1, 10, 100, and 200 ng/mL) in RD-ES and SK-ES-1 cells (n = 3). C-J. Dose-response study of the TrkB-specific inhibitor Ana-12 (μM) (C, D) the TrkA-specific inhibitor GW 441756 (μM) (E, F) and the pan-Trk inhibitor K252a (nM) G-K. on tumor cell proliferation in human ES RD-ES, SK-ES-1, and SK-ES-1R cell lines. The IC50 for each drug was determined by trypan blue counting assay after 72 h treatments. Cell proliferation was assessed in triplicate, in at least three independent experiments. Effect (fraction affected vs. control) is plotted on the y-axis versus dose on the x-axis. The linear correlation coefficient r of the median-effect plot was >0.90 for all tested agents, ensuring measurement accuracy and conformity to mass-action. Positive controls (100% cell viability) are denoted as ‘0’ effect on the y-axis. L. Cell counts following combination treatments of Ana-12 with GW 441756 (0.1 and 1 μM, 72 h; n = 3). * vs. control; # vs. respective Ana-12 dose; & vs. respective GW 441756 dose. Single, double, and triple symbols represent p < .05, p < .01, p < .001, respectively.
