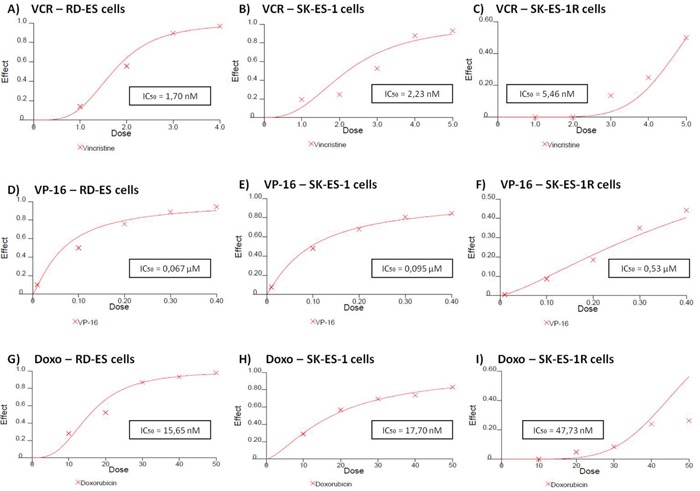
Figure 5. Reduced antitumor effects of VCR (nM) A, B, C. VP-16 (μM) D, E, F. and Doxo (nM) G, H, I. in chemoresistant ES cell line (SK-ES-IR) relative to two non-resistant cell lines.

Dose-effect IC50 concentration curves with drug effect (fraction affected vs. control) represented on the y-axis and dose shown on the x-axis. Cell proliferation was assessed with the trypan blue counting assay after 72-h drug treatments in triplicate, in at least three independent series of experiments. Positive controls corresponding to 100% cell viability are denoted as ‘0’ effect on the y-axis. The linear correlation coefficient r of the median-effect plot was >0.90 for all tested agents, indicating that the measurements were accurate and had conformity to mass-action. Doxo = doxorubicin; VCR = vincristine; VP-16 = etoposide.
