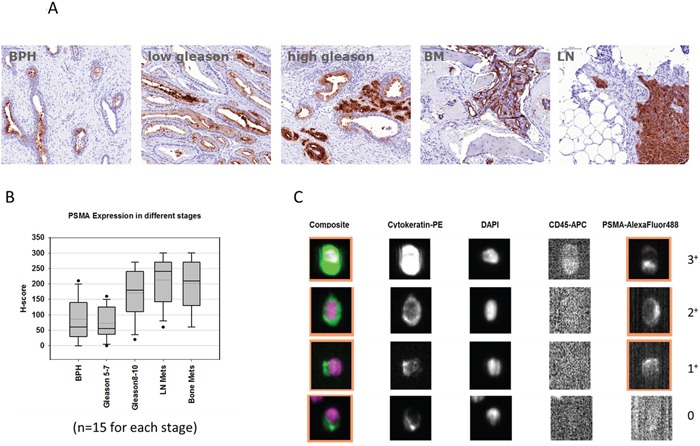
Figure 5.

A and B. Tissue micro array (TMA) analyses from 75 prostate cancer patients with benign prostate hyperplasia (n = 15), gleason score 5 - 7 (n = 15), gleason score 8 - 10 (n = 15), and patients with bone (BM) or lymph node (LN) metastases (n = 15 each). C. Representative images of circulating tumor cells detected by CellSearch® with different signal intensities for PSMA (score 0 - 3+).
