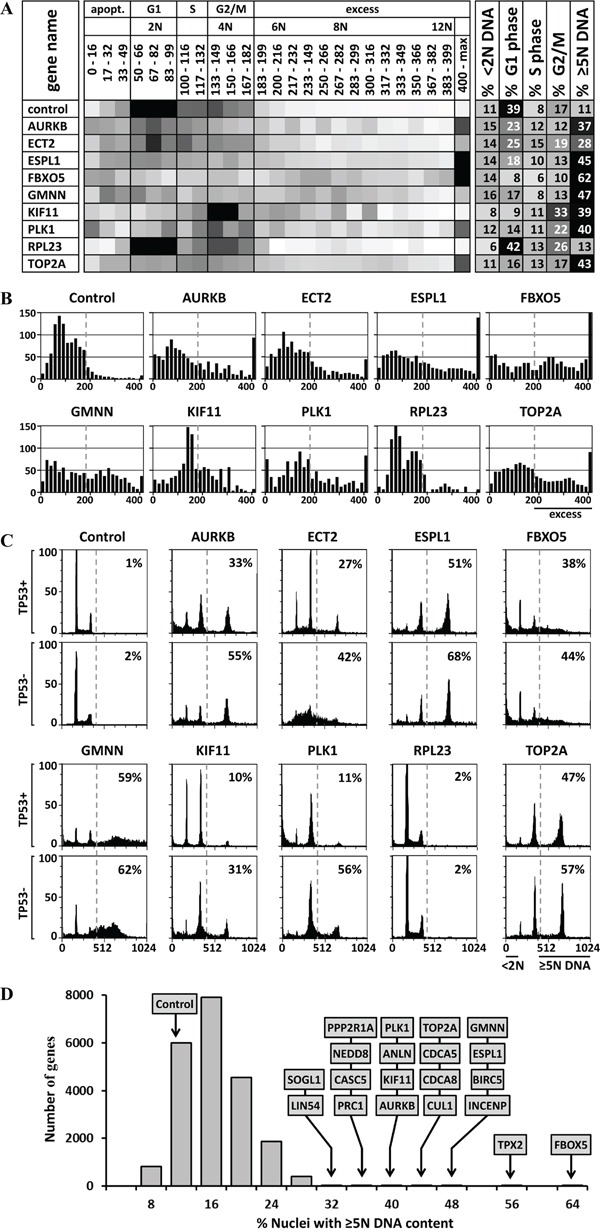
Figure 2. DNA content analysis and validation of HTS data.

A. Heat maps were created of the distribution of cells with a nuclear DNA content from <2N to >12N. Ten examples are shown; Supplementary Figure 1 contains the complete list of 85 candidate genes. Darker shading indicates higher fraction of cells with the indicated DNA content. The percentage of cells in G1 phase (2N DNA), S phase (>2N<4N DNA), and G2/M phase (4N DNA) was calculated, as well as the percentage of cells undergoing apoptosis (<2N DNA) or excess DNA replication (≥5N DNA). B. The data in panel A were expressed as histograms. C. Independent siRNAs against 8 candidate genes (AURKB, ECT2, ESPL1, FBXO5, GMNN, KIF11, PLK1 AND TOP2A), as well as one non-candidate gene (RPL23), and a control siRNA were validated in TP53+ and TP53- isogenic HCT116 cells using standard siRNA transfection and FACS protocols. Supplementary Figure 2 contains all the FACS profiles for the 42 validated genes. D. The 21,584 genes tested in the HTS were plotted according to the percentage of cells with ≥5N nuclear DNA content when depleted by the median effect siRNA in the HTS. The 20 genes with the greatest effect on preventing EDR are indicated. Of the cells treated with silent siRNA (control), 11% contained ≥5N nuclear DNA. These data revealed the fraction of cells with nuclear DNA content equivalent to G1 phase (2N), S phase (>2N<4N), G2/M phase (4N), apoptosis (<2N), or EDR (≥5N).
