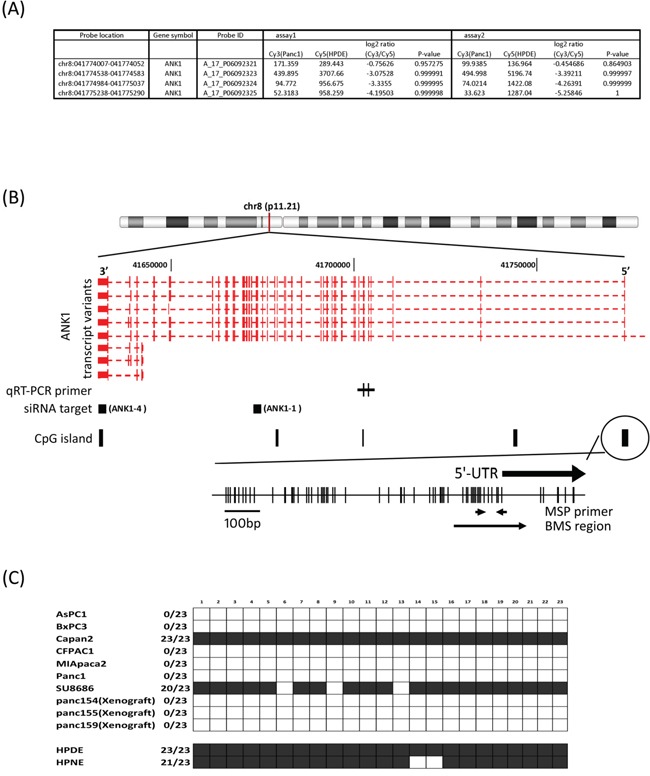
Figure 1.

A. MCA array data. Cy5/Cy3 log2-fold change and p-value was obtained by Agilent's ChIP Analytics 1.3 software. B. Genetic map of the ANK1 locus on chromosome 8q11.21 showing the location of transcripts, CpG islands, CpG sites, primer locations and siRNA target region. The quantitative RT-PCR primers are designed to recognize the large or small ANK1 isoforms as indicated. The location of the shRNA target sequences are represented by black squares. There are 4 CpG-islands defined in the UCSC genome browser and primers for MSP and BMS are designed to determine the methylation status of the 5′flanking CpG island. C. Methylation status of 23 CpG sites in the ANK1 promoter region determined by bisulfite sequencing (BMS region in 1B). Black box: methylated; white box: unmethylated.
