
Figure 1. Overview of all specimens and lncRNAs.
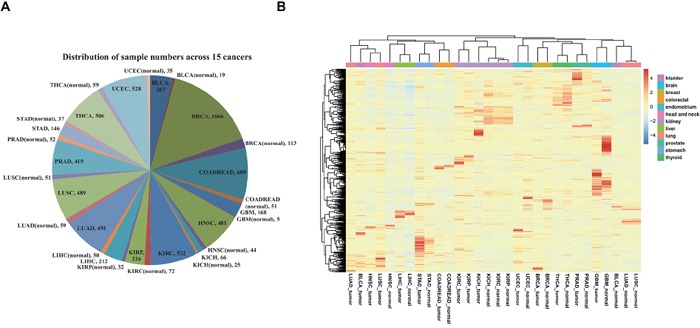
A. Distributions of all specimens across 15 cancer types. B. Global expression profiles of 985 lncRNAs across cancer types. The tree displays their average expression values. The mean was computed from all specimens derived from the same type of normal tissue or tumor. Clustering was performed using the average and correlation metrics in the pheatmap function.