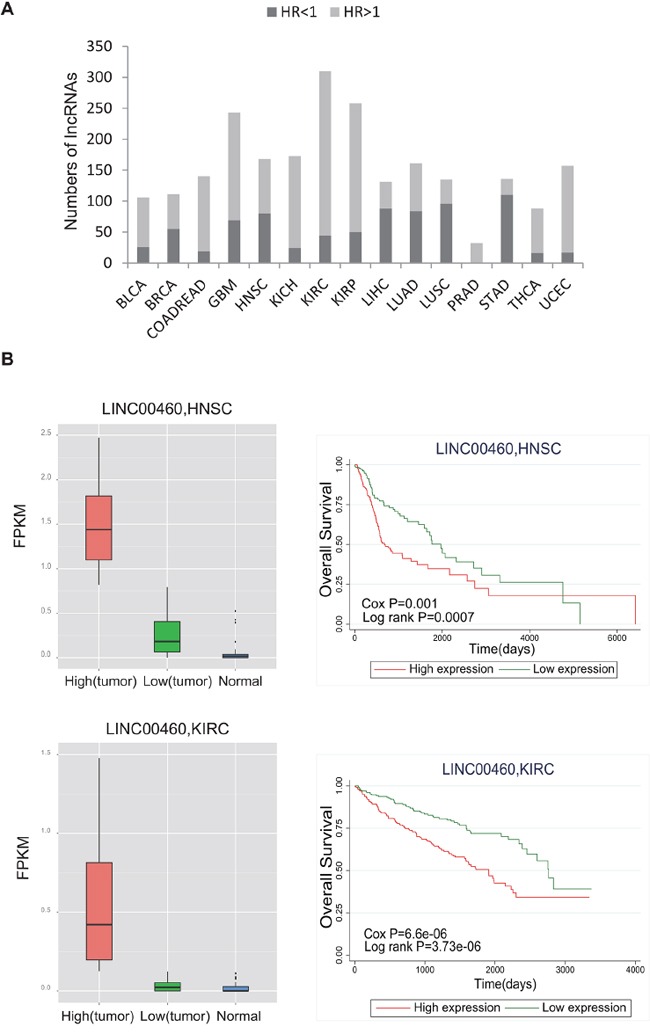
Figure 4. Evaluation of the prognostic power of lncRNAs.

A. The bar plot shows the number of significantly prognostic lncRNAs in each cancer type. The dark color represents HR<1, and the light color represents HR>1. B. The box plot shows differential expression of LINC00460 between tumor and normal tissue for HNSC and KIRC. Survival curves demonstrate that higher expression of LINC00460 is associated with worse survival. LINC00460 expression values were dichotomized into low and high expression groups using the within-cohort median expression value as a cutoff. Red curves represent the high expression group, and green curves represent the low expression group. Survival curves were plotted using Kaplan–Meier methods, and statistical significance was assessed using log-rank tests.
