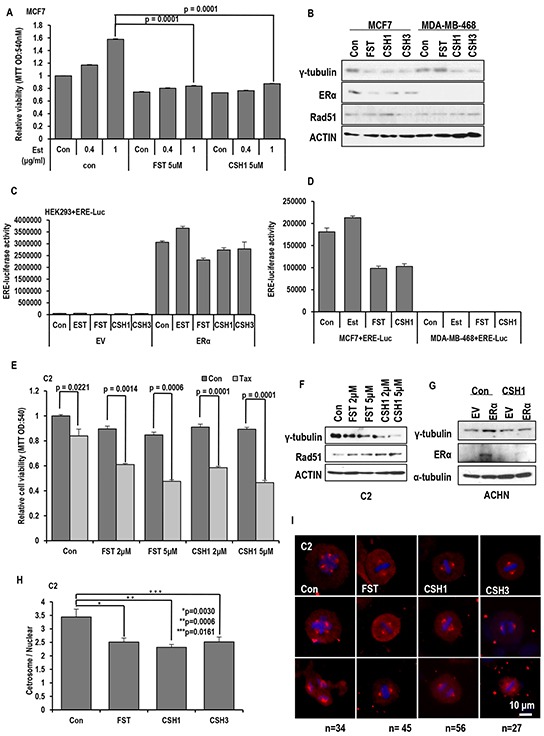
Figure 7. Similar effect of CSH1 with FST.

A. Inhibitory effect of CSH1 on Est-induced cell proliferation. Proliferation of ER-α positive MCF-7 cells was increased by Est-treatment in a dose-dependent manner. Similarly with FST, CSH1 suppresses the Est-induced proliferation in MCF-7. Chemicals were treated as indicated. 72 hr later, MTT assay were performed to check cell viability. B. Suppression of γ-tubulin expression by FST is only in MCF-7 cells, but CSH1 could reduce γ-tubulin in both MCF-7 and MDA-MB-468 cells. C. ER-α mediated transcription activity is reduced by CSH1 and CSH3 in ER-α transfected HEK293 cells. ERE-luciferase vectors and ER-α were co-transfected in HEK 293 cell to estimate ERE-luciferase activity. D. The similar result is reproduced in MCF-7 cells. CSH1 effectively suppressed ERE luciferase activity like FST. ERE-luciferase vectors were transfected to ERα-positive MCF7 cells and ERα-negative MDA-MB-468 cells. ERE- Luciferase assay was performed after the 4 hr treatment of each chemical. E. Taxol-induced cell death is provided by CSH1 similar to FST in VHL-negative C2 cells with dosage-dependent sensitization. F. Western blot analysis shows that expression of γ-tubulin and ER-α are decreased but Rad51 expression is increased by CSH1 treatment. G. The expression of ER-α is suppressed by CSH1. ER-α was transfected to VHL-positive ACHN cells. After the transfection, CSH1 (5 μM) was treated. 72 hr later, western blot was performed. H and I. The MTOC amplification is inhibited by rare ginsenosides compared with FST in VHL-negative C2 cells. About 50 cells were counted for average numbers of MTOC in each indicated conditions and representative pictures are shown. FST (5 μM), CSH1 (5 μM) and CSH3 (5 μM) were treated to VHL-negative C2 cells. After 72 hr, IF staining was performed. Cells were stained with anti-γ-tubulin antibody (Red) and DAPI (Blue).
