
Figure 3. The Kaplan-Meier survival estimates for the high and low molecular prognostic score (mPS) groups, by morphological subtype, are shown.
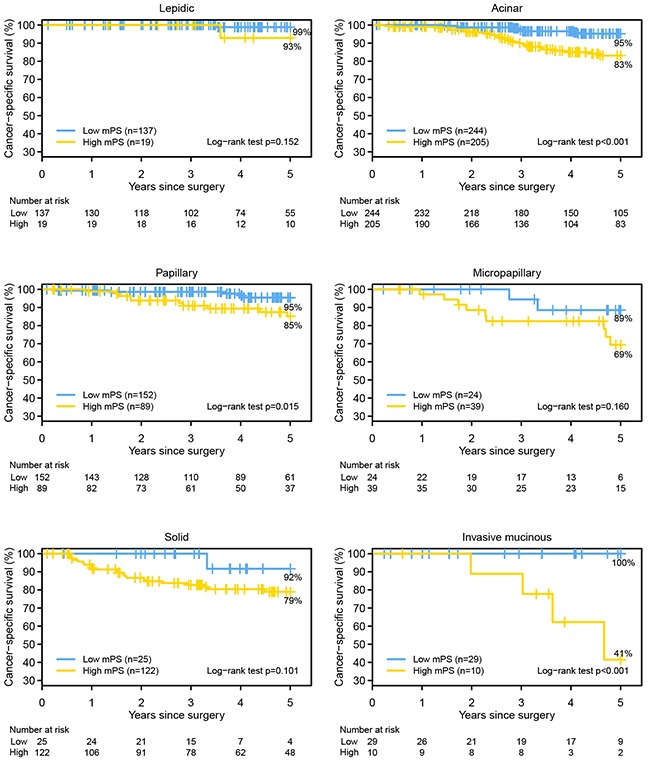
The 5-year lung cancer–specific survival for low mPS vs high mPS for each subtype: lepidic predominant, 99% vs 93% (P = 0.152); acinar predominant, 95% vs 83% (P < 0.001); papillary predominant, 95% vs 85% (P = 0.015); micropapillary predominant, 89% vs 69% (P = 0.16); solid predominant, 92% vs 79% (P = 0.101); and invasive mucinous adenocarcinoma, 100% vs 42% (P < 0.001).