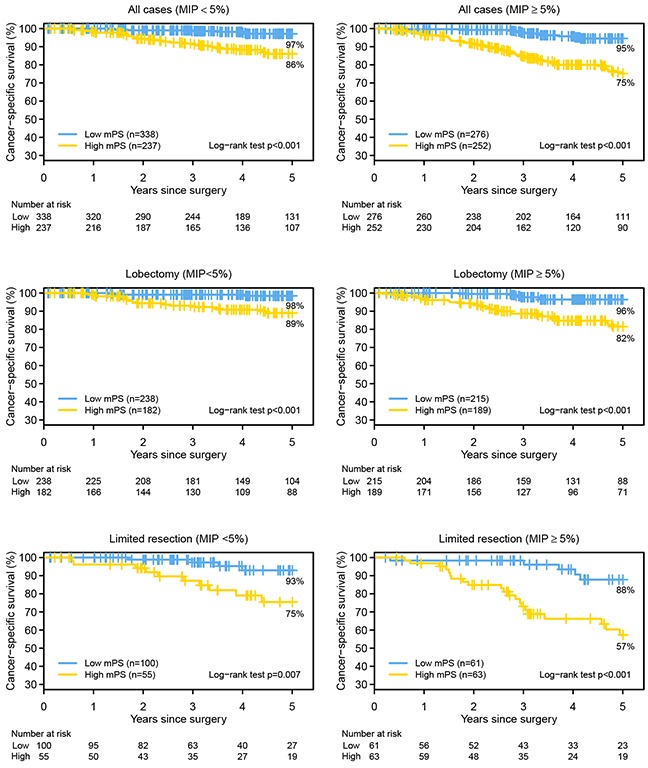
Figure 4. The Kaplan-Meier survival estimates for the high and low molecular prognostic score (mPS) groups, by the absence (<5%) or presence (≥5%) of micropapillary (MIP) pattern and surgical procedure, are shown.

The 5-year lung cancer–specific survival for low mPS vs high mPS: all cases (MIP < 5%), 97% vs 86% (P < 0.001); all cases (MIP ≥ 5%), 95% vs 75% (P < 0.001); lobectomy (MIP < 5%), 98% vs 89% (P < 0.001); lobectomy (MIP ≥ 5%), 96% vs 82% (P < 0.001); limited resection (MIP < 5%), 93% vs 75% (P = 0.007); and limited resection (MIP ≥ 5%), 88% vs 57% (P < 0.001).
