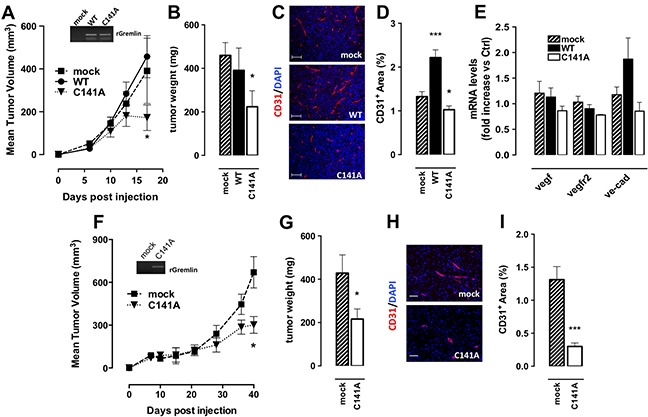
Figure 7. GremlinC141A reduces the tumorigenic and angiogenic potential of EO771 cells.

A. 5×10⁵ mock (▪)- or gremlinWT (•)- or gremlinC141A -EO771 (▼) cells were injected orthotopically in 15-week-old female mice (6 mice/group). Tumor growth was followed for up to 17 days. Tumor volume (in mm3) is expressed as a function of time. In the inset the PCR analysis for exogenous rat gremlin mRNA in tumor samples is shown. At the end of experiments tumors were harvested, weighed B and analysed by immunofluorescence using anti CD31 antibodies (red). Nuclei were counterstained with DAPI (blue) (scale bar 100 μm) C. D. CD31+ area was quantified and normalized to area (3-5 fields per tumor). Data are the mean ± SEM. E. murine vegf, vegfr2 and ve-cadherin (ve-cad) mRNA expression levels were measured by RT-qPCR. Data were normalized on murine gapdh and are expressed as fold increase vs mock tumors. F. 4×10⁶ mock (▪)- or gremlinC141A TRAMP-C2 (▼) cells were injected subcutaneously in 15-week-old male mice (6 mice/group). Tumor growth was followed for up to 40 days. Tumor volume (in mm3) is expressed as a function of time. In the inset the PCR analysis for exogenous rat gremlin mRNA in tumor samples is shown. At the end of experiments tumors were harvested, weighed G and vessel density was analysed by immunofluorescence using anti CD31 antibodies H. CD31+ area was quantified and normalized to area (3-5 fields per tumor). Data are the mean ± SEM I. *, p<0.05; ***, p<0.005, One-Way ANOVA followed by Bonferroni's test versus control.
