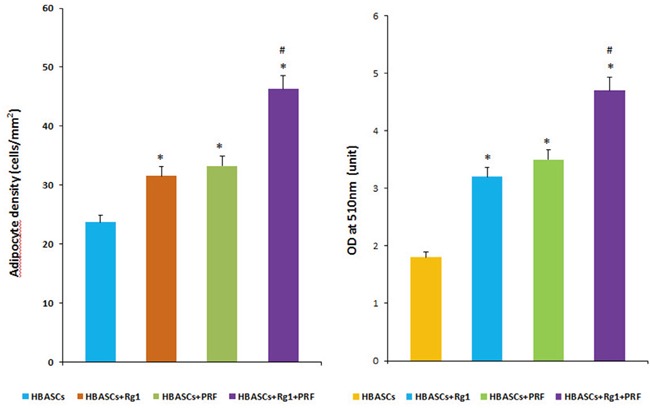
Figure 6. Quantitative measurement of adipogenesis in 4 groups.

The number of adipocytes and amount of intracellular lipid were higher in groups B and C than in the control group, and HBASCs treatment with both Rg1 & PRF (group D) augments this effect (Figure 6, *p <0.01; #p <0.01).
