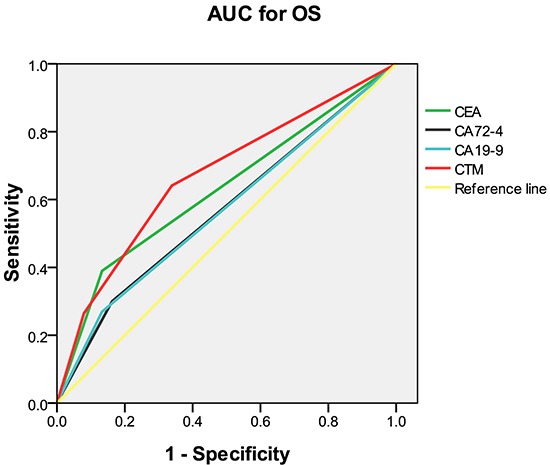
Figure 2. Comparison of the areas under the curves for survival prediction.

AUC = area under the curve; OS = overall survival; CEA = carcinoembryonic antigen; CA = carbohydrate antigen; CTM = the combination of preoperative tumor markers.

AUC = area under the curve; OS = overall survival; CEA = carcinoembryonic antigen; CA = carbohydrate antigen; CTM = the combination of preoperative tumor markers.