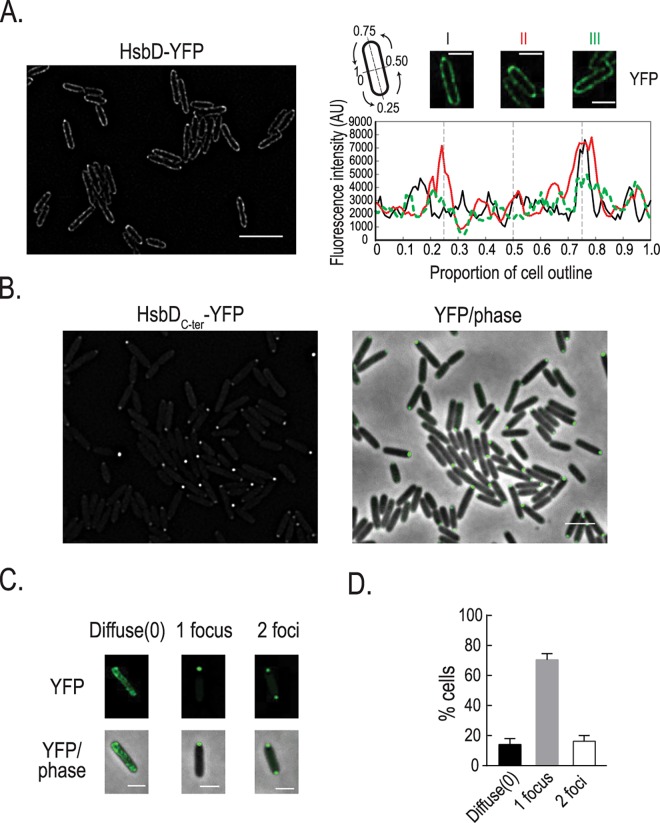
Fig 8. HsbD polar localization in P. aeruginosa.
(A) Localization of HsbD-YFP (green) in cells grown in LB medium and induced with 100μM IPTG for two hours (left panel). Three representative cells (right panel) where chosen for the quantification of the fluorescence intensity across the cell contour. Black line: cell I, red: cell II and green: cell III. A pseudo-colored fluorescence image (green YFP) of each cell is shown on top of the graph. Cartoon: representation of coordinates reported in the graph. Scale bar = 3 μm (B) Localization of the GGDEF-containing domain of HsbD (HsbDC-ter-YFP) in cells grown in LB medium and induced with 100μM IPTG for two hours. First column shows fluorescence images (YFP) while the second column the overlay of the fluorescence channel (in green) and the phase contrast image. Scale bar = 2 μm. (C) Representative cells where chosen to illustrate the three localization patterns of HsbDC-ter-YFP. Scale bar = 1 μm (D) Quantification of the distinct HsbDC-ter-YFP localization patterns. Error bars represent the standard deviation (n = 3 replicates of more than 200 cells each). At least three independent experiments were performed.

