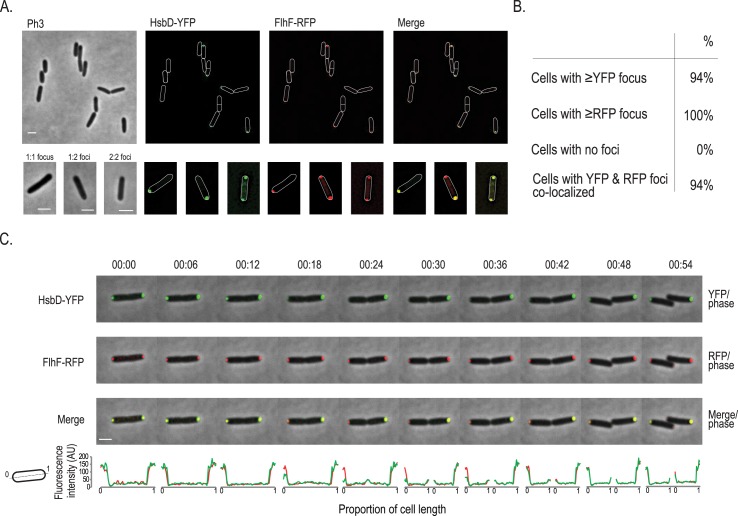
Fig 9. Dynamics of HsbD and FhlF cellular (co-)localization.
(A) Localization of HsbD-YFP (green) and FhlF-RFP (red) in a P. aeruginosa wild-type strain. Scale bar = 2 μm. Bottom panel: three representative patterns (1:1, 1:2 foci and 2:2 YFP:RFP foci) are illustrated in a closer view. Scale bar = 1 μm. Cell boundaries are delineated in white. (B) HsbD and FhlF polar localization frequency and their colocalization. More than 200 cells were analyzed from different fields. At least three independent experiments were performed. (C) Dynamics of HsbD-YFP (green) and FhlF-RFP (red). An overlay of the fluorescence channel(s) and the phase contrast image illustrate HsbD-YFP and FlhF-RFP subcellular localization pattern. Fluorescence images are shown in S6 Fig. Scale bar = 1 μm. Bottom panel shows the quantification of the HsbD-YFP (green) and FhlF-RFP (red) fluorescence intensity across the cell length. Cartoon: representation of coordinates reported in the graph.

