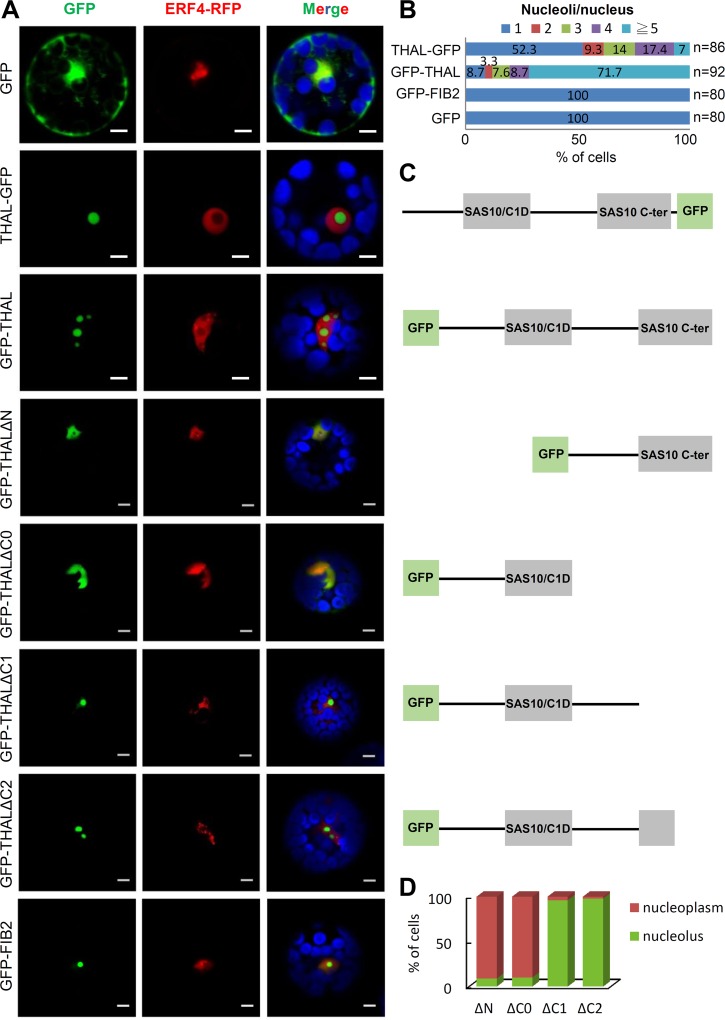
Fig 2. Overexpression of THAL results in multiple nucleoli.
(A) Transient expression of THAL-GFP / GFP-THAL / GFP-THALΔN / GFP-THALΔC0 / GFP-THALΔC1 / GFP-THALΔC2 in protoplast cells. ERF4-RFP signals represent nuclei and blue signals represent chlorophyll autofluorescence in merged images. Scale bars = 5 μm. (B) Statistical analysis of nucleoli per nucleus when overexpressing THAL-GFP, GFP-THAL, GFP-FIB2, or GFP in protoplasts. Total number of cells counted n = 86, 92, 80, and 80, respectively. (C) Schematic representation of proteins that were overexpressed on the left in (A). (D) Statistical analysis of localization of truncated THAL proteins. Total number of cells counted n = 80 for each construct.

