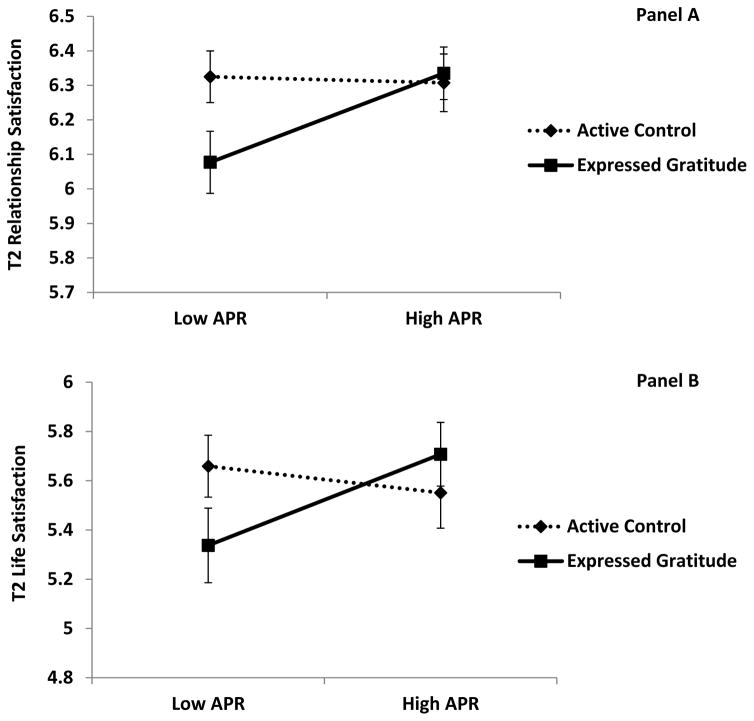
Figure 5.
Individual difference in active perceived partner responsiveness (APR) predicting T2 outcomes in two conditions. Corresponding T1 variable was controlled. Range of T2 relationship and life satisfaction scale: [1, 7]. For relationship satisfaction (panel A), pre-tested relationship satisfaction, global partner perceived responsiveness, and age were controlled. Condition × APR interaction: b=−.20, p=. 089; simple slope: b=.19, p=.035 for Expressed Gratitude condition, b= −.01, p=.871 for Active Control condition. For life satisfaction (panel B), pre-tested life satisfaction and global partner perceived responsiveness were controlled. Condition × APR interaction: b=−.35, p= .090; simple slope: b= .27, p=.076 for Expressed Gratitude condition, b= − .08, p=.571 for Active Control condition.

