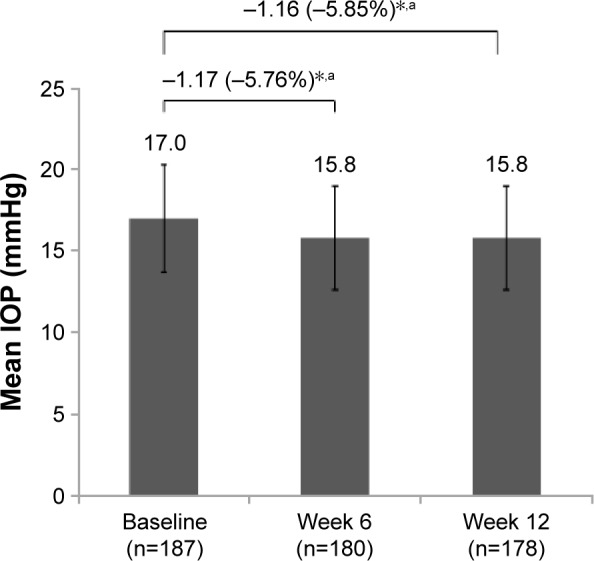
Figure 2.

Mean (±SD) IOP throughout the study and change from baseline.
Notes: *P<0.001; mixed-model analysis. aData are presented as the difference of the mean (%).
Abbreviations: IOP, intraocular pressure; SD, standard deviation.

Mean (±SD) IOP throughout the study and change from baseline.
Notes: *P<0.001; mixed-model analysis. aData are presented as the difference of the mean (%).
Abbreviations: IOP, intraocular pressure; SD, standard deviation.