
Figure 2.
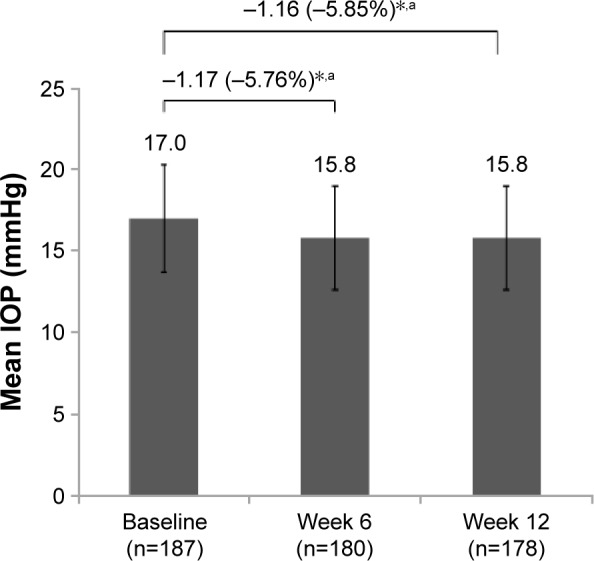
Mean (±SD) IOP throughout the study and change from baseline.
Notes: *P<0.001; mixed-model analysis. aData are presented as the difference of the mean (%).
Abbreviations: IOP, intraocular pressure; SD, standard deviation.
Official websites use .gov
A
.gov website belongs to an official
government organization in the United States.
Secure .gov websites use HTTPS
A lock (
) or https:// means you've safely
connected to the .gov website. Share sensitive
information only on official, secure websites.
Mean (±SD) IOP throughout the study and change from baseline.
Notes: *P<0.001; mixed-model analysis. aData are presented as the difference of the mean (%).
Abbreviations: IOP, intraocular pressure; SD, standard deviation.