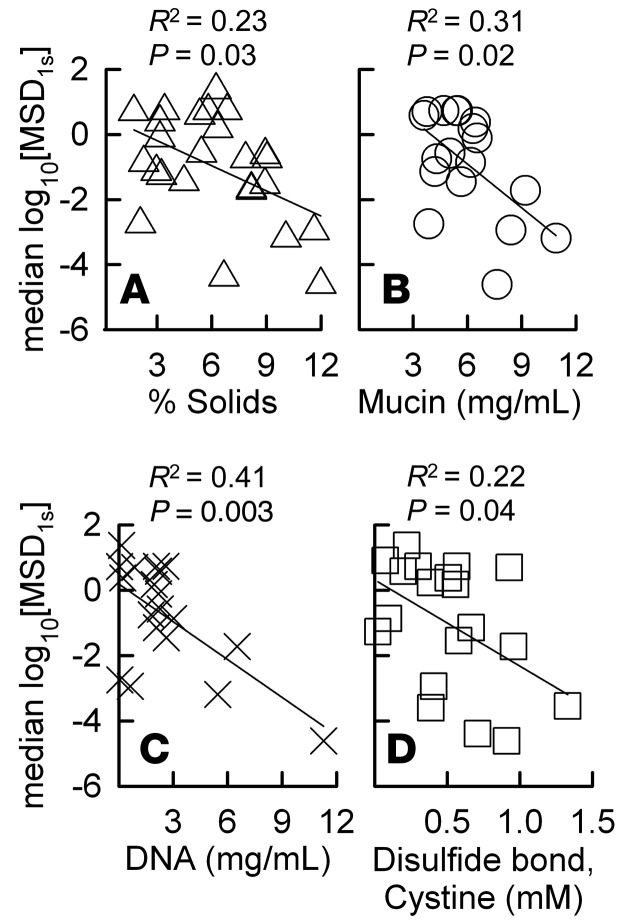
Figure 3. Impact of cystic fibrosis (CF) sputum biochemical composition on microstructure.
The correlations of log base 10 of the median MSD per μm2 at time τ = 1 s (median log10[MSD1s]) of 100-nm MIP measured in sputum samples from 18 CF patients versus (A) percent solids, (B) mucin, (C) DNA, and (D) cystine (disulfide bond) content of each sputum sample. R2 values were determined based on a linear regression analysis, and the correlations were considered statistically significant when P < 0.05.

