. 2016 Sep 30;5:e18296. doi: 10.7554/eLife.18296

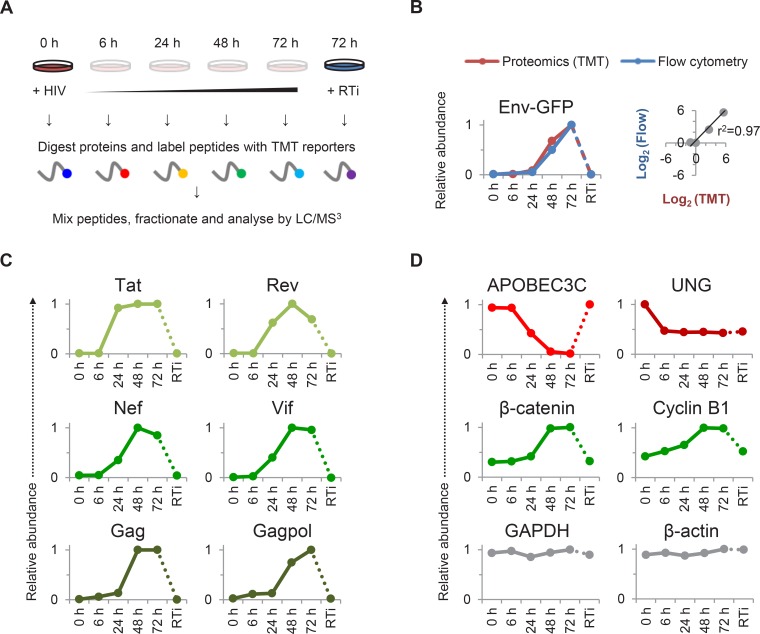
Figure 1. TMT-based proteomic time course analysis of HIV-infected cells.

(A) Workflow of 6-plex TMT-based whole cell proteomic time course experiment. CEM-T4 T cells were infected with NL4-3-dE-EGFP HIV at an MOI of 10. In subsequent figures timepoints 1–5 show protein abundance 0, 6, 24, 48 and 72 hr after HIV infection (where 0 hr = uninfected cells) and timepoint 6 shows protein abundance 72 hr after HIV infection in the presence of reverse transcriptase inhibitors (RTi). (B) Comparison of temporal profiles of Env-GFP obtained by proteomic (TMT) versus flow cytometric quantitation. Cells from (A) were analysed by flow cytometry. Relative abundance is expressed as a fraction of maximum TMT reporter ion or fluorescence intensity. For linear regression, log2 (fold change in protein abundance compared with uninfected cells) is shown. (CD) Temporal profiles of viral proteins (C) and previously reported HIV targets (D). GAPDH and β-actin are included as controls. Relative abundance is expressed as a fraction of maximum TMT reporter ion intensity.

DOI: http://dx.doi.org/10.7554/eLife.18296.003

Figure 1—source data 1. Interactive spreadsheet of TMT time course data.
Interactive spreadsheet enabling generation of temporal profiles of protein abundance for any quantitated genes of interest ('Gene search and plots' worksheet). Detailed instructions are incorporated into the spreadsheet. The complete (unfiltered) TMT-based proteomic time course dataset ('Complete TMT time course data' worksheet) and a database of gene name aliases ('Gene name aliases' worksheet) are also included. Protein abundance is depicted on a colour scale (red = downregulated; green = upregulated). The number of unique peptides, peptides and peptide spectral matches are specified for each protein, along with ratio counts and variability for each TMT condition.
DOI: 10.7554/eLife.18296.004

Figure 1.

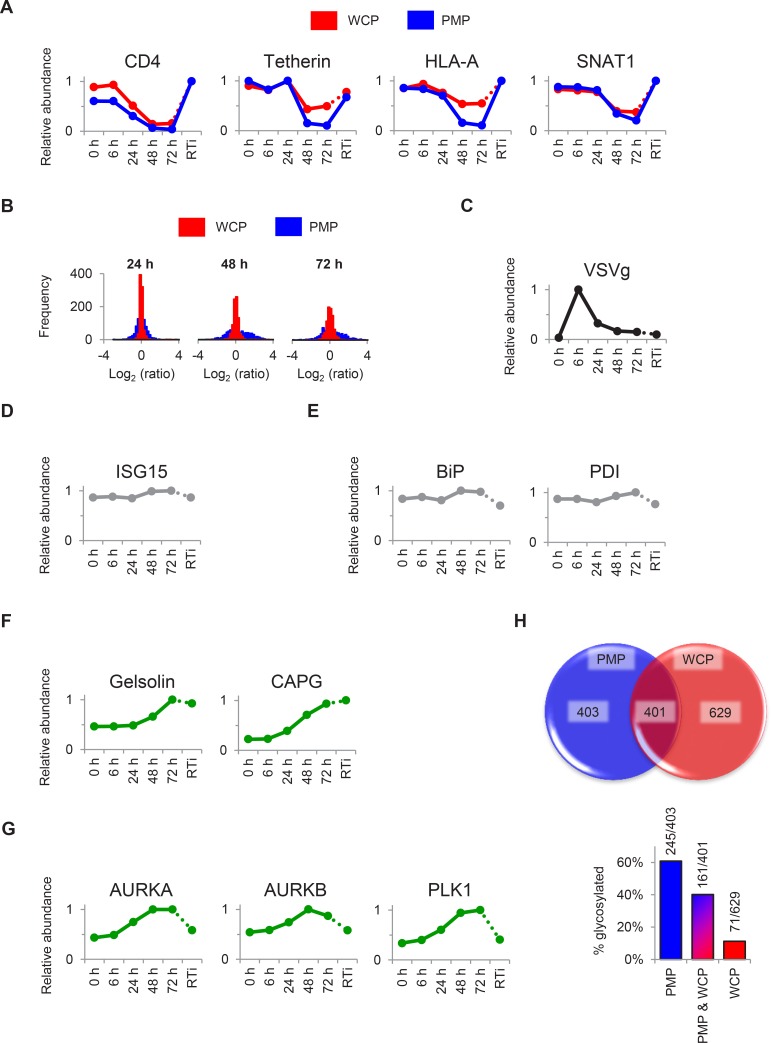
Figure 1—figure supplement 1. Additional temporal profiles and comparison with plasma membrane profiling.

Figure 1—figure supplement 1.

(A) Comparison of temporal profiles of cell surface Nef- (CD4 and HLA-A) and Vpu- (CD4, tetherin and SNAT1) targets obtained by whole cell or plasma membrane proteomics. Expression levels from our whole cell proteomic analysis (WCP, red) and our previous plasma membrane profiling analysis ([Matheson et al., 2015]; PMP, blue) are shown. Relative abundance is expressed as a fraction of maximum TMT reporter ion intensity. (B) Dynamic range of protein regulation observed by whole cell or plasma membrane proteomics. Histograms show the frequencies of log2 (fold change compared with mock/uninfected cells) values for proteins quantitated in our whole cell proteomic analysis (WCP, red) and our previous PMP ([Matheson et al., 2015]; blue) at 24, 48 and 72 hr. All proteins identified by >1 unique peptide in both WCP and PMP experiments are shown. (CG) Temporal profiles of selected control proteins (CE), actin regulatory proteins (F) and mitotic kinases (G). Relative abundance is expressed as a fraction of maximum TMT reporter ion intensity. (H) Quantitation of plasma membrane proteins by whole cell or plasma membrane proteomics. The pie chart shows overlap of proteins with Gene Ontology Cellular Compartment annotations indicative of plasma membrane localisation quantitated in our whole cell proteomic analysis (WCP, red) and our previous PMP analysis ([Matheson et al., 2015]; blue). Protein numbers are indicated. The bar chart details the glycosylation status of proteins quantitated in WCP (red), PMP (blue) or both (tan) experiments. Glycosylation sites were identified from the UniProt Knowledgebase (accessed on 4/12/15 at http://www.uniprot.org). Protein numbers (glycosylated/total) are indicated.
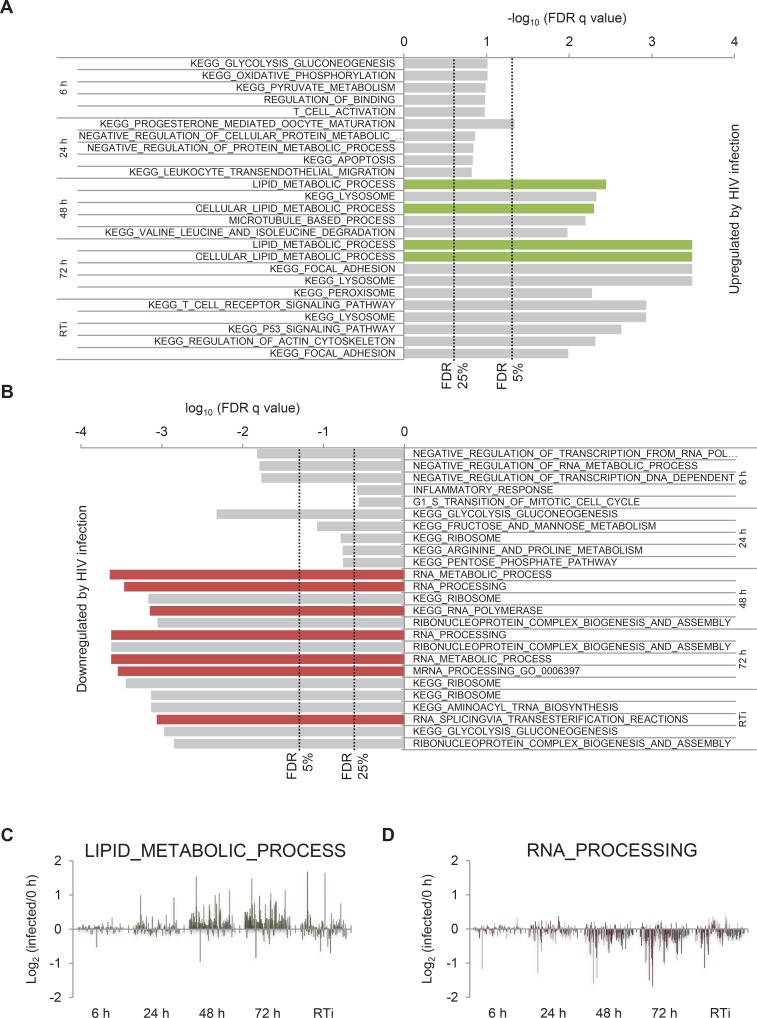
Figure 1—figure supplement 2. Gene set enrichment analysis of HIV infection.

Figure 1—figure supplement 2.

(A) Pathways and processes upregulated by HIV infection. KEGG Pathway and Gene Ontology Biological Process gene sets enriched in infected cells at the indicated timepoints compared with uninfected cells were determined using GSEA. Indicative false discovery rate (FDR) thresholds for gene set enrichment are shown and gene sets related to lipid metabolism are highlighted (green). (B) Pathways and processes downregulated by HIV infection. KEGG Pathway and Gene Ontology Biological Process gene sets enriched in uninfected cells compared with infected cells at the indicated timepoints were determined using GSEA. Indicative FDR thresholds for gene set enrichment are shown and gene sets related to RNA processing are highlighted (green). (CD) Expression levels of all quantitated proteins in Lipid_Metabolic_Process (C) and RNA_Processing (D) gene sets. Log2 (fold change in protein abundance compared with uninfected cells) is shown at the indicated timepoints.