. 2016 Sep 30;5:e18296. doi: 10.7554/eLife.18296

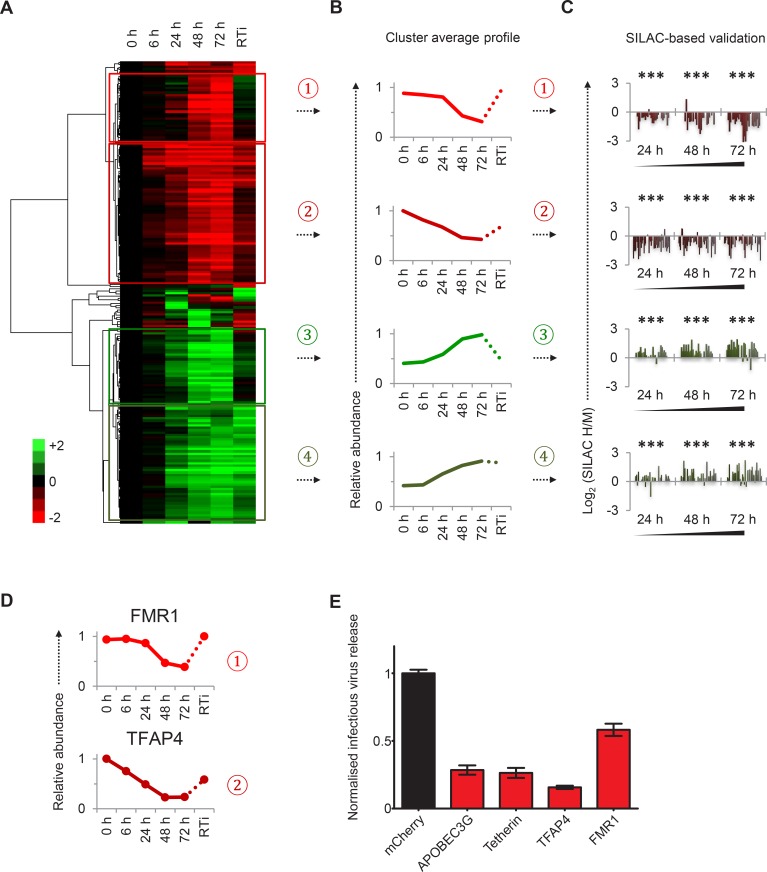
Figure 2. Identification and SILAC-based proteomic validation of novel HIV targets.

(A) Hierarchical cluster analysis of temporal profiles of proteins regulated by HIV. The heatmap shows log2 (fold change in protein abundance compared with uninfected cells) and clusters #1–4 are indicated. (B) Average temporal profiles of proteins in clusters #1–4. Relative abundance is expressed as a fraction of maximum TMT reporter ion intensity. (C) SILAC-based validation of novel HIV targets. CEM-T4 T cells pre-labelled with heavy amino acids were infected with NL4-3-dE-EGFP HIV at an MOI of 10, and control cells pre-labelled with medium amino acids were mock-infected without virus. Aliquots of HIV-infected (heavy; H) and mock (medium; M) cells were harvested sequentially at the indicated timepoints and subjected to SILAC-based whole cell proteomic analysis (Figure 2—figure supplement 1A). Log2 (H/M protein abundance) at 24, 48 and 72 hr is shown for proteins from clusters #1–4. ***p value<0.001. (D) Temporal profiles of novel HIV-1 targets FMR1 and TFAP4. Relative abundance is expressed as a fraction of maximum TMT reporter ion intensity. (E) Antagonism of HIV production by FMR1 and TFAP4. 293T cells were co-transfected with pNL4-3-dE-EGFP/pMD.G and either mCherry or the indicated cellular protein. 48 hr culture supernatants were assayed for infectious virus by infection of HeLa cells. Well-characterised restriction factors APOBEC3G and tetherin were included as controls, and infectious virus release normalised compared with mCherry. Mean values and standard errors are shown from at least 4 replicates. All four proteins significantly reduced viral release compared with mCherry in an ANOVA analysis with Bonferroni post-test, p values<0.001.

DOI: http://dx.doi.org/10.7554/eLife.18296.007

Figure 2—source data 1. Clusters #1–4 summary proteomic data.
Spreadsheet of all proteomic data for proteins in clusters #1–4. Each cluster is represented by a single worksheet, with proteins ranked according to the hierarchical cluster analysis shown (Figure 2A) and protein abundance depicted on a colour scale (red = downregulated; green = upregulated). As well as data from the TMT-based proteomic time course experiment (Figure 1 and Figure 1—source data 1), additional data from the SILAC-based proteomic validation (Figure 2C and Figure 2—figure supplement 1A) and TMT-based single timepoint experiment (Figure 4A and Figure 4—figure supplement 1A) are also included. The number of unique peptides is shown for each protein (TMT experiments) and each timepoint (SILAC experiment). q values for the TMT-based single timepoint experiment were determined using Limma with Benjamini-Hochberg adjustment for multiple testing, with q values < 0.01 highlighted in gold.
DOI: 10.7554/eLife.18296.008

Figure 2.

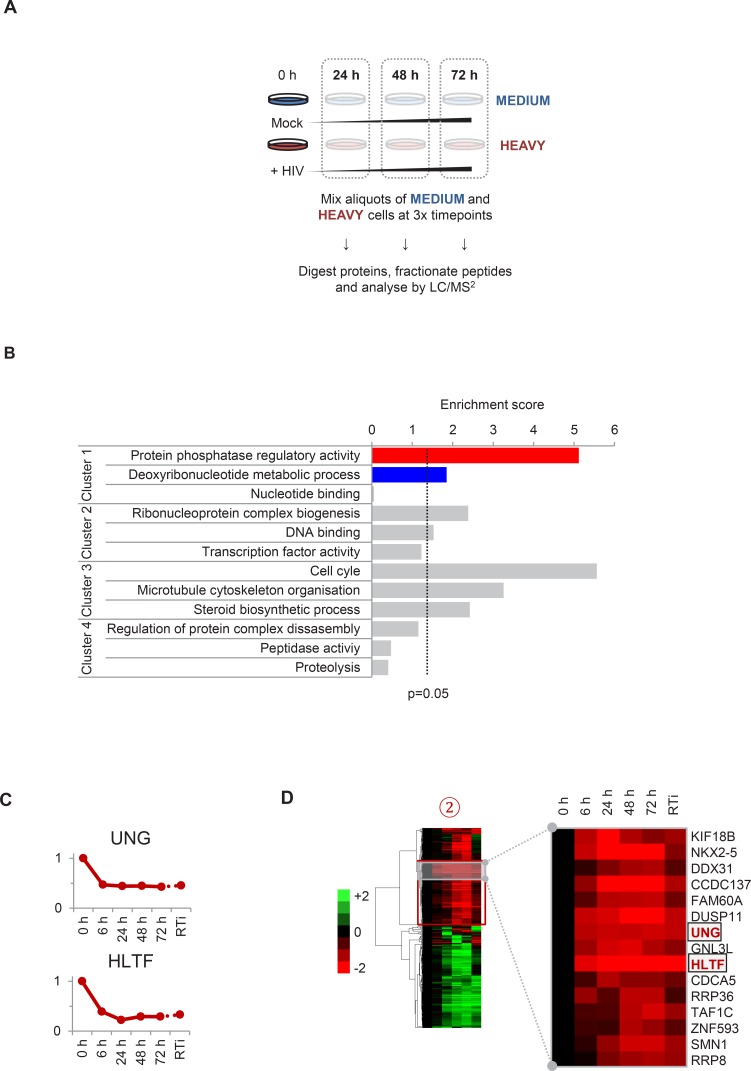
Figure 2—figure supplement 1. Workflow of SILAC-based proteomic time course experiment, functional analysis of clusters #1–4 and prediction of novel Vpr targets.

Figure 2—figure supplement 1.

(A) Workflow of SILAC-based proteomic validation time course experiment. CEM-T4 T cells pre-labelled with heavy amino acids were infected with NL4-3-dE-EGFP HIV at an MOI of 10, and control cells pre-labelled with medium amino acids were mock-infected without virus. Aliquots of HIV-infected (heavy) and mock (medium) cells were harvested sequentially at the indicated timepoints and subjected to SILAC-based whole cell proteomic analysis. (B) Functional annotation clusters enriched amongst proteins from clusters #1–4. Enrichment of Gene Ontology Molecular Function and Biological Process terms against a background of all quantitated proteins was determined using DAVID. Functional annotation clusters with enrichment scores > 1.3 (equivalent to a geometric mean of all included enrichment p values<0.05) were considered significant. Representative Gene Ontology terms are indicated. (C) Temporal profiles of Vpr targets UNG and HLTF. Relative abundance is expressed as a fraction of maximum TMT reporter ion intensity. (D) Enlargement of part of cluster #2 from hierarchical cluster analysis (Figure 2A). The heatmap shows log2 (fold change in protein abundance compared with uninfected cells). Previously characterised Vpr targets UNG and HLTF are highlighted (red).