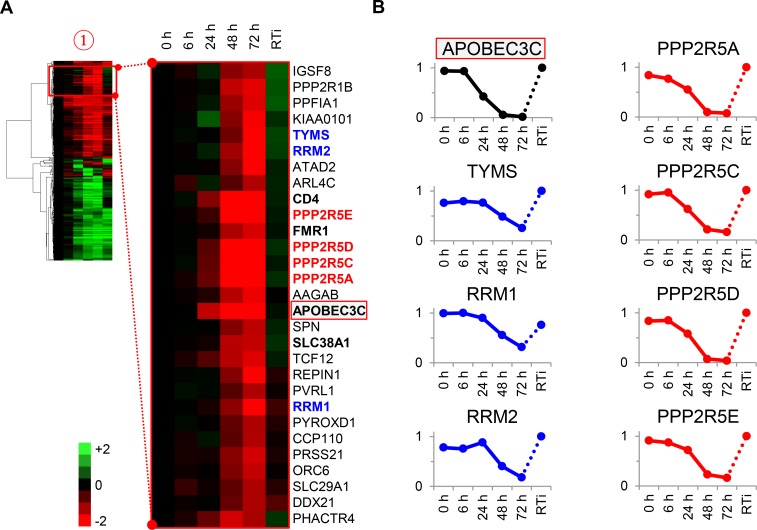
Figure 3. Cellular proteins progressively downregulated by HIV infection.
(A) Enlargement of cluster #1 from hierarchical cluster analysis (Figure 2A). The heatmap shows log2 (fold change in protein abundance compared with uninfected cells). Enzymes associated with deoxynucleotide metabolism (blue) and B56 family regulatory subunits of serine/threonine protein phosphatase PP2A (red) are highlighted, along with known Vif target APOBEC3C (boxed) and other proteins of interest (bold). (B) Temporal profiles of enzymes associated with deoxynucleotide metabolism (blue) and B56 family regulatory subunits of serine/threonine protein phosphatase PP2A (red). Relative abundance is expressed as a fraction of maximum TMT reporter ion intensity, and the temporal profile of APOBEC3C is shown for comparison.


