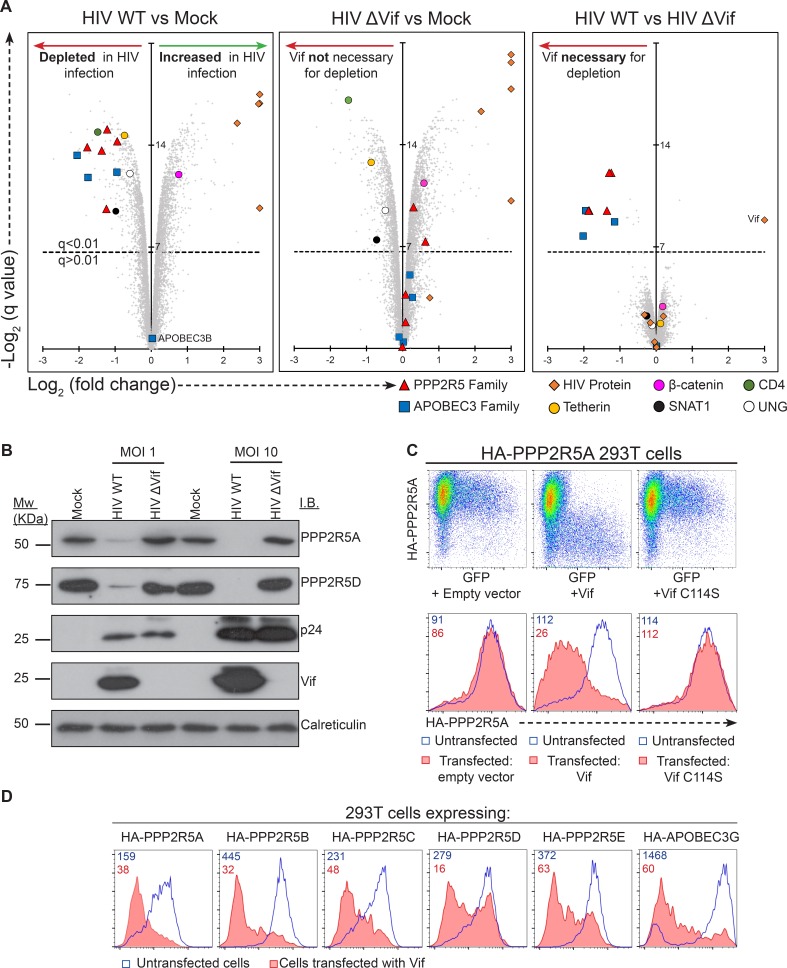
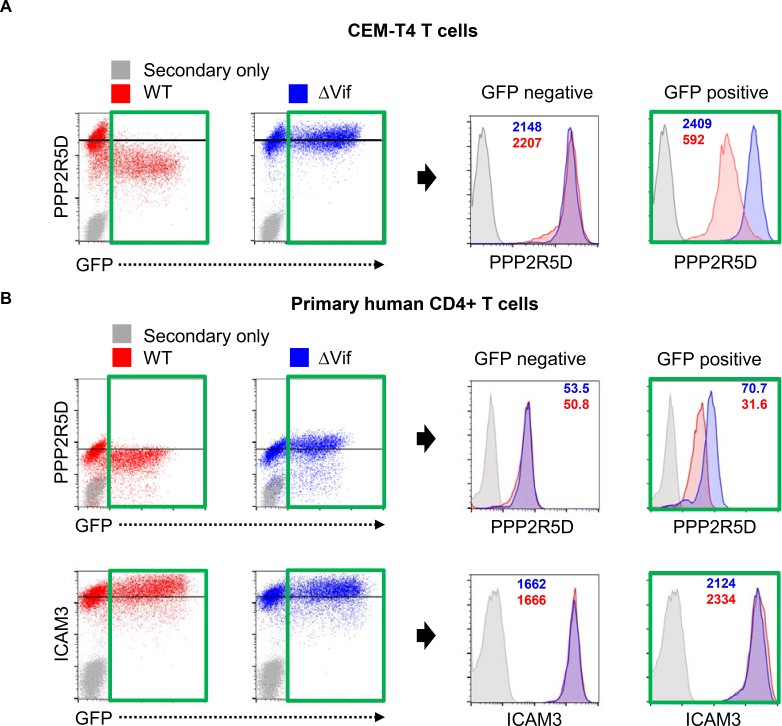
Figure 4. Vif-mediated depletion of PP2A-B56 family members PPP2R5A-E.
(A) Proteomic analysis of CEM-T4 T cells infected with WT and ΔVif HIV. Cells were infected with NL4-3-ΔE-EGFP viruses at an MOI of 1.5, and harvested 48 hr post-infection. Scatterplots display pairwise comparisons between WT, ΔVif and mock-infected cells. Each point represents a single protein, plotted by its log2 (fold change in abundance) versus the statistical significance of that change. q values were determined using Limma with Benjamini-Hochberg adjustment for multiple testing, with increasing −log2 (q value) indicating increasing significance. Points above the dotted line change with a q value < 0.01. HIV proteins and host proteins of interest are highlighted with different symbols (see key). (B) Depletion of PPP2R5A and PPP2R5D during HIV infection. CEM-T4 T-cells were infected with NL4-3-dE-EGFP WT and ΔVif viruses at an MOI of 1 or 10 and analysed by immunoblot (IB) 48 hr post-infection. p24 (capsid), Vif and calreticulin are included as controls. (C) Depletion of exogenous PPP2R5A by Vif. 293T cells stably expressing HA-PPP2R5A were co-transfected with GFP plus empty vector, NL4-3 Vif or NL4-3 Vif with a single amino acid mutation C114S and analysed by intracellular flow cytometry for HA 36 hr post-transfection. Histograms show GFP positive (transfected, red shading) and negative (untransfected, blue line) cells. Median fluorescence intensity (MFI) values are shown for GFP positive (red) and negative (blue) cells. (D) Depletion of PPP2R5A-E family members by Vif. 293T cells stably expressing HA-tagged PPP2R5A-E or APOBEC3G were co-transfected with GFP plus NL4-3 Vif expression vectors, and intracellular HA staining quantitated by flow cytometry 36 hr post transfection. Histograms show GFP positive (transfected, red shading) and negative (untransfected, blue line) cells. MFI values are shown for GFP positive (red) and negative (blue) cells.


