. 2016 Sep 30;5:e18296. doi: 10.7554/eLife.18296

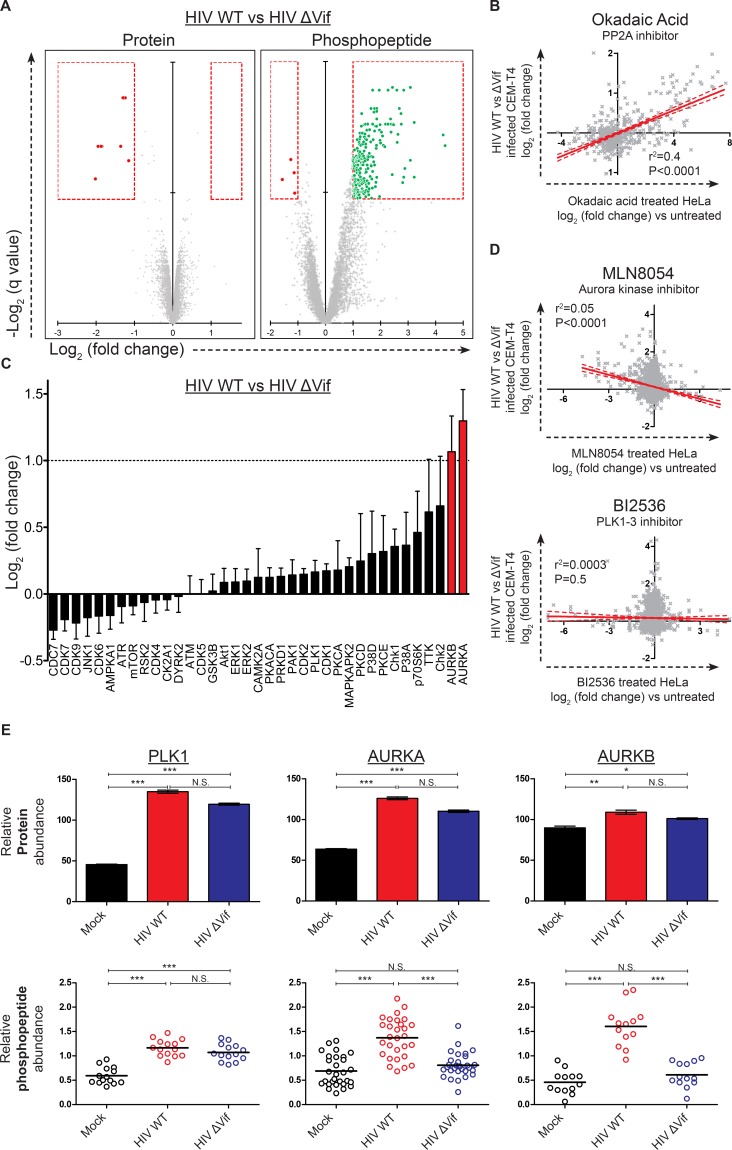
Figure 6. Global phosphoproteomic analysis of cells infected with WT or ∆Vif HIV.

(A) Vif-dependent changes in peptide and phosphopeptide abundance. CEM-T4 T cells from Figure 4A and Figure 4—figure supplement 1A were subjected to TMT-based phosphoproteomic analysis. Scatterplots display differences in protein (left panel, as in Figure 4A, right panel) and phosphopeptide abundance (right panel) between WT and ΔVif-infected cells. Each point represents a single protein or phosphopeptide, plotted by its log2 (fold change in abundance) versus the statistical significance of that change. q values were determined using Limma with Benjamini-Hochberg adjustment for multiple testing, with increasing −log2 (q value) indicating increasing significance. Proteins and phosphopeptides downregulated (red) or upregulated (green) with a fold change > 2 and q value < 0.01 are highlighted. (B) Comparison of changes in phosphopeptide abundance between WT and ΔVif-infected CEM-T4 T cells with previously published data for okadaic acid-treated HeLa cells (Kauko et al., 2015). Lines show linear correlation with associated 95% confidence areas, r2 values and p values of a non-zero correlation. (C) Analysis of changes in phosphopeptide abundance between WT and ΔVif-infected cells CEM-T4 T cells using the PhosphoSitePlus kinase-substrate database. Bars show log2 (fold change in phosphopeptide abundance) for peptides spanning known kinase substrate sites. Error bars show the standard error of the mean. (D) Comparison of changes in phosphopeptide abundance between WT and ΔVif-infected CEM-T4 T cells with previously published data for kinase inhibitor-treated HeLa cells (Kettenbach et al., 2011). At low concentrations, MLN8054 is a selective AURKA inhibitor, but at 5 μM (as shown) reduced activity of AURKB and PLK1 is also observed. Lines show linear correlation with associated 95% confidence areas, r2 values and p values of a non-zero correlation. (E) Vif-specific hyperphosphorylation of aurora kinase substrates. Protein abundances of PLK1, AURKA and AURKB were compared with normalised abundances of manually curated phosphopeptides targeted by the respective kinases. Abundances of kinase proteins were compared using Limma with Benjamini-Hochberg adjustment for multiple testing. Abundances of target phosphopeptides were compared by Repeated Measures ANOVA with Bonferroni post-test. N.S., p value>0.05; *p value<0.05; **p value<0.01; ***p value<0.001.

DOI: http://dx.doi.org/10.7554/eLife.18296.019

Figure 6—source data 1. Single timepoint phosphoproteomic data.
Spreadsheet of cellular phosphopeptides identified in mock, WT and ΔVif HIV-infected cells in the TMT-based single timepoint phosphoproteomic experiment (Figure 6, Figure 4—figure supplement 1A and Figure 6—figure supplement 1). Peptide sequence, details of the cognate protein and the position of the peptide within the protein are shown. The column 'Phosphosite Probabilities' indicates the probability that each serine, threonine or tyrosine within the peptide is phosphorylated. The amino acid is stated (S, serine; T, threonine; Y, tyrosine) with the position in the peptide in parentheses, followed by the probability (%). Each potential phosphosite is separated by a semicolon. Phosphosites with a probability of over 75% are listed in the column 'Modifications in Master Proteins', which shows a summary of the phosphorylated amino acids identified and their position in the protein. Log2 (fold change) compares phosphopeptide abundance normalized to total protein abundance, with abundance depicted on a colour scale (red = downregulated; green = upregulated). q values were determined using Limma with Benjamini-Hochberg adjustment for multiple testing, with q values < 0.01 highlighted in gold.
DOI: 10.7554/eLife.18296.020
Figure 6—source data 2. Previously reported AURKA, AURKB and PLK1 targets.
AURKA, AURKB and PLK1 targets were manually curated from the literature. Peptides listed overlap reported sites of phosphorylation by AURKA, AURAKB or PLK1, or are the only phosphopeptide identified from a protein known to be phosphorylated by one of these kinases, but at an unknown site. Peptides where the identified phosphorylation site explicitly matches the one reported are plotted in Figure 6E (blue shading; excluded peptides highlighted in red text). Studies cited: (Asano et al., 2013; Dephoure et al., 2008; Hengeveld et al., 2012; Kettenbach et al., 2011; Santamaria et al., 2011; Welburn et al., 2010; Yu et al., 2005).
DOI: 10.7554/eLife.18296.021

Figure 6.

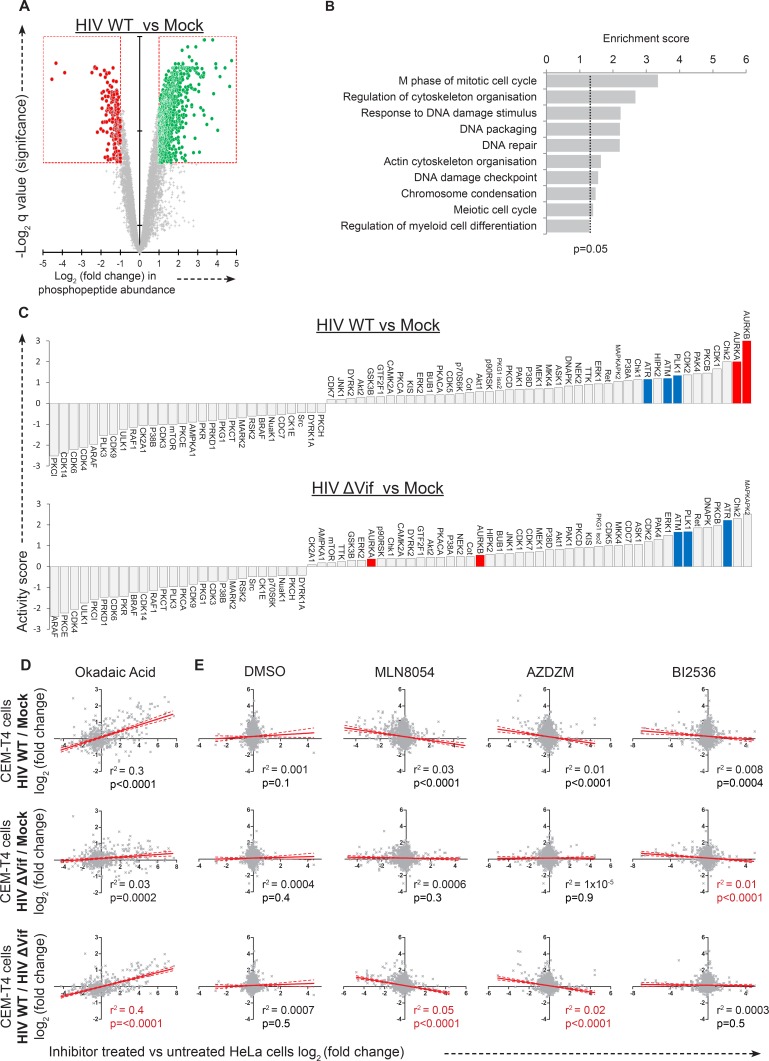
Figure 6—figure supplement 1. Further phosphoproteomic analysis.

Figure 6—figure supplement 1.

(A) Remodelling of the cellular phosphoproteome by HIV infection. CEM-T4 T cells from Figure 4A and Figure 4—figure supplement 1A were subjected to TMT-based phosphoproteomic analysis. The scatterplot displays differences in phosphopeptide abundance between WT HIV and mock-infected cells. Each point represents a single phosphopeptide, plotted by its log2 (fold change in abundance) versus the statistical significance of that change. q values were determined using Limma with Benjamini-Hochberg adjustment for multiple testing, with increasing -log2 (q value) indicating increasing significance. Phosphopeptides downregulated (red) or upregulated (green) with a fold change > 2 and q value < 0.01 are highlighted. (B) Functional annotation clusters enriched amongst proteins hyperphosphorylated in the presence of HIV infection. Proteins containing phosphopeptides significantly upregulated (q values < 0.01) in cells infected with WT HIV compared with mock-infected cells were analysed. Enrichment of Gene Ontology Molecular Function and Biological Process terms against a background of all identified phosphoproteins was determined using DAVID. Functional annotation clusters with enrichment scores > 1.3 (equivalent to a geometric mean of all included enrichment p values<0.05) were considered significant. Representative Gene Ontology terms are indicated. (C) PhosFate analysis of kinase activity in HIV-infected versus mock-infected cells. Data are shown for WT HIV (upper panel) and ΔVif HIV (lower panel). A positive activity score indicates enhanced phosphorylation of kinase-specific phosphosites in infected cells. Aurora kinases A and B (AurA/AurB; red) and other control mitotic/checkpoint kinases (PLK1, ATR and ATM; blue) are highlighted. Kinases represented in the dataset by a single target phosphosite were excluded. (DE) Comparison of phosphoproteomic dataset with previously published data for (D) okadaic acid-treated (Kauko et al., 2015) and (E) kinase inhibitor-treated (Kettenbach et al., 2011) HeLa cells. Each row shows a different pairwise comparison: top row, HIV WT versus mock; middle row, HIV ΔVif vs mock; bottom row, HIV WT vs HIV ΔVif. Each column shows a different inhibitor treatment. At low concentrations, MLN8054 is a selective AURKA inhibitor, but at 5 μM (as shown) reduced activity of AURKB and PLK1 is also observed. AZDZM indicates a combined analysis of selective AURKB inhibitors AZD1152 and ZM447439. BI2536 is a selective PLK1-3 inhibitor. Each scatterplot compares log2 (fold change) in WT/ ΔVif/mock-infected cells (y axis) with log2 (fold change) in inhibitor treated cells (x axis). Lines indicate linear correlation with 95% confidence areas, r2 values and p values of a non-zero correlation. For each column, the most significant correlation is highlighted (red).