. 2016 Sep 30;5:e18296. doi: 10.7554/eLife.18296

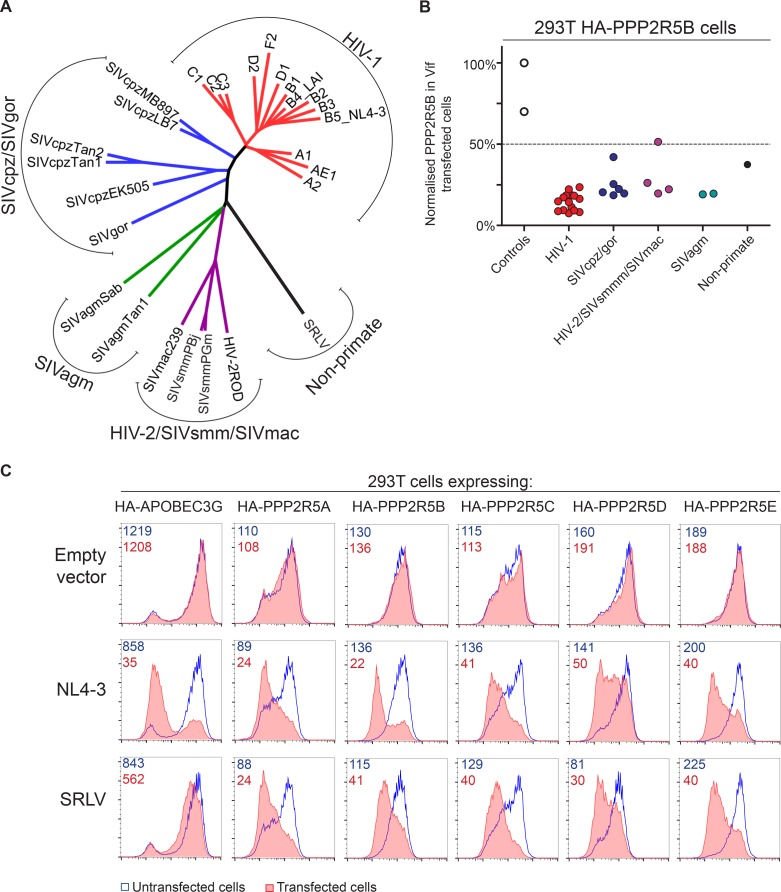
Figure 7. Phylogenetic conservation of PPP2R5A-E subunit degradation.

(A) Phylogenetic tree based on the amino acid alignment of Vif variants used in this study. (B) Conservation of PPP2R5B subunit degradation by phylogenetically diverse lentiviral Vif variants. 293T cells stably expressing HA-PPP2R5B were transfected with a panel of lentiviral Vif variants and analysed by intracellular flow cytometry for HA 36 hr post-transfection. The median fluorescence intensity of the transfected population is shown as a proportion of median fluorescence intensity of the untransfected population for each condition, normalized to the empty vector control. Datapoints represent mean values for different Vif variants obtained from up to four independent experiments. (C) Depletion of PPP2R5A-E subunits by small ruminant lentivirus Vif. 293T cells stably expressing HA-PPP2R5A-E or HA-APOBEC3G were transfected with NL4-3 (HIV-1) or SRLV Vif variants. Histograms show GFP positive (transfected, red shading) and negative (untransfected, blue line) cells. MFI values are shown for GFP positive (red) and negative (blue) cells.

DOI: http://dx.doi.org/10.7554/eLife.18296.023

Figure 7.

Figure 7—figure supplement 1. Identity/similarity matrix of lentiviral Vif variants.

Figure 7—figure supplement 1.

Upper-right half of matrix shows pairwise similarity between Vif variants, lower-right half shows pairwise identity. For pairwise comparisons with NL4-3 Vif, relevant similarity values (black lines) and identity values (white lines) are highlighted. Matrix is based on a Vif amino acid alignment carried out with the PSI-Coffee variant of the T-Coffee alignment algorithm (Notredame et al., 2000) and the SIAS tool available at http://imed.med.ucm.es/Tools/sias.html using default settings.
Figure 7—figure supplement 2. Additional data on phylogenetic conservation of PPP2R5A-E subunit degradation.

Figure 7—figure supplement 2.

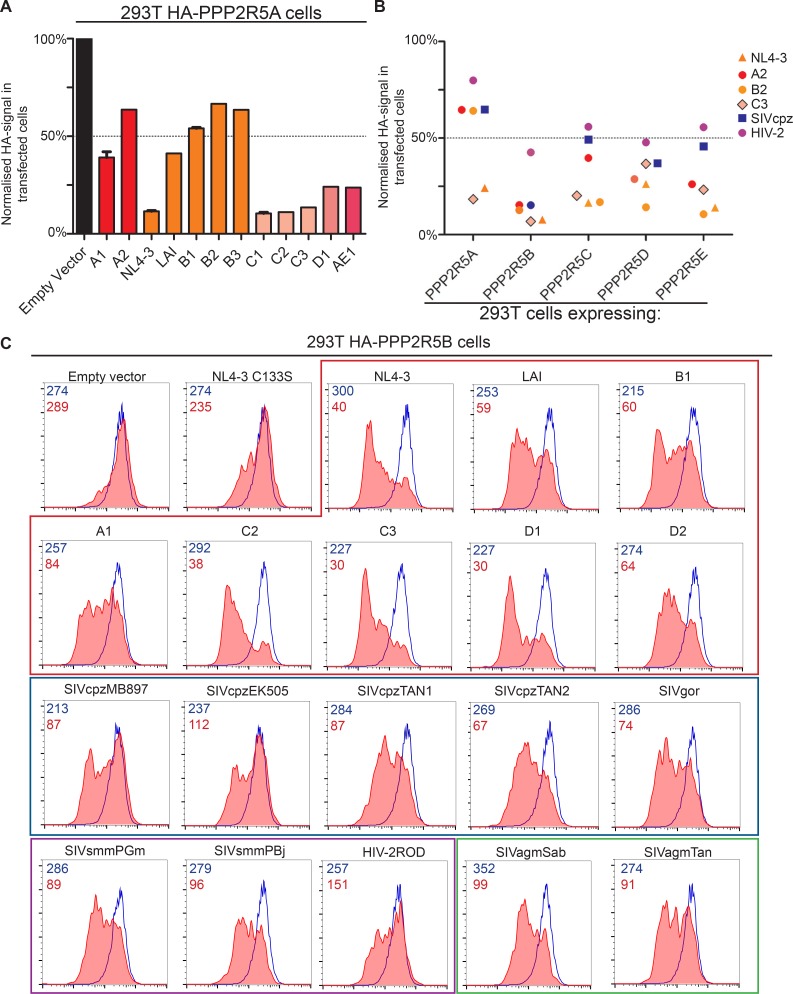
(A) Conservation of PPP2R5A subunit degradation by HIV-1 Vif variants. 293T cells stably expressing HA-PPP2R5A were transfected with the indicated Vif variants and analysed by intracellular flow cytometry for HA 36 hr post-transfection. The median fluorescence intensity of the transfected population is shown as a proportion of median fluorescence intensity of the untransfected population for each condition, normalized to the empty vector control. Mean values and standard errors are shown. (B) Conservation of PPP2R5A-E subunit degradation by phylogenetically diverse lentiviral Vif variants. 293T cells stably expressing different HA-tagged PPP2R5A-E subunits were transfected with the indicated Vif variants and analysed by intracellular flow cytometry for HA 36 hr post-transfection. Median fluorescence intensity of the transfected population is shown as a proportion of median fluorescence intensity of the untransfected population for each condition, normalized to the empty vector control. Each datapoint represents a different Vif variant. (C) Representative data for primate lentiviral Vif degradation of PPP2R5B. Data shown in Figure 7B was acquired in several experiments, one example is shown here. Histograms show GFP positive (transfected, red shading) and negative (untransfected, blue line) cells. MFI values are shown for GFP positive (red) and negative (blue) cells.
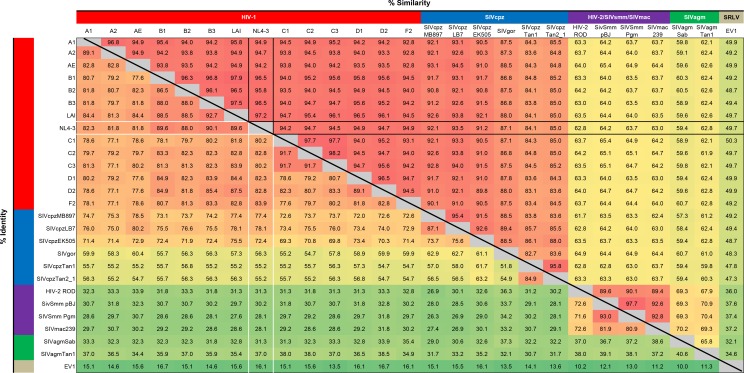
Figure 7—figure supplement 3. Mechanism of PPP2R5E degradation by SRLV Vif.

Figure 7—figure supplement 3.

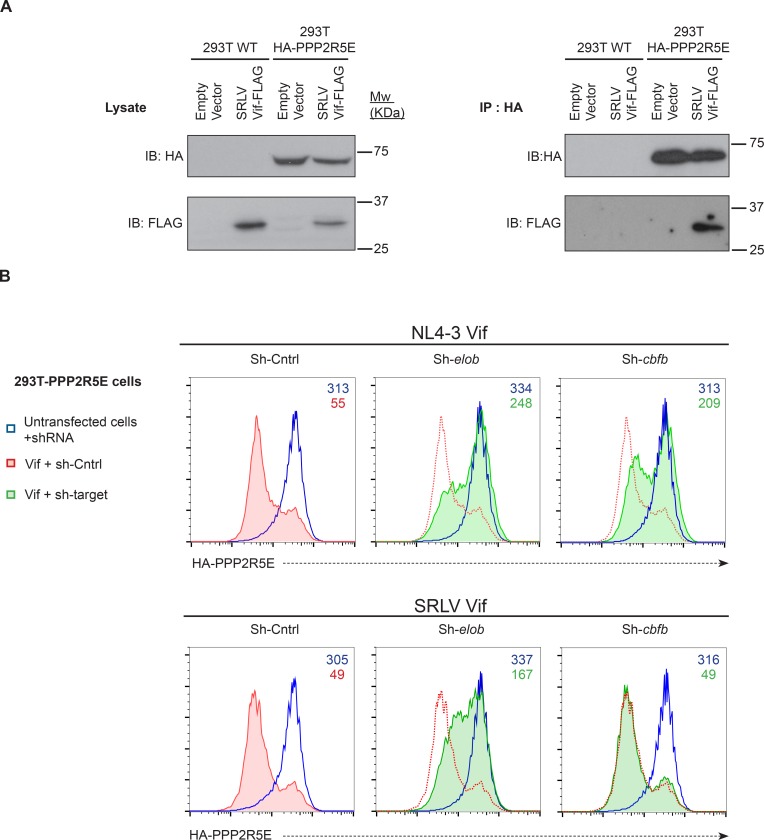
(A) Co-immunoprecipitation of SRLV Vif with PPP2R5E. WT 293T cells or 293T cells stably expressing HA-tagged PPP2R5E were transfected with FLAG-tagged SRLVE Vif, pre-treated with bortezomib (10 nM) for 16 hr, and analysed by immunoblot (IB) for HA-PPP2R5E and FLAG-Vif 48 hr post-infection (left panels). Lysates were subjected to immunoprecipitation (IP) with anti-HA and re-analysed by immunoblot (right panels). 293T cells transfected with empty vector were included as controls. (B) CBFβ-independent degradation of PPP2R5E by SRLV Vif. 293T cells stably expressing HA-PPP2R5E were transduced with the indicated shRNA. Cells were then transfected with NL4-3 Vif (upper panels) or SRLV Vif (lower panels) and analysed by intracellular flow cytometry for HA. Red/green shading shows Vif-transfected cells in the indicated shRNA background. Red lines showing HA staining in cells transduced with control shRNA are included in each panel for reference. Cells were analysed 36 hr post-transfection, and transfected cells determined by co-transfection with GFP. MFI values are shown for transfected (red/green) and untransfected (blue) cells.