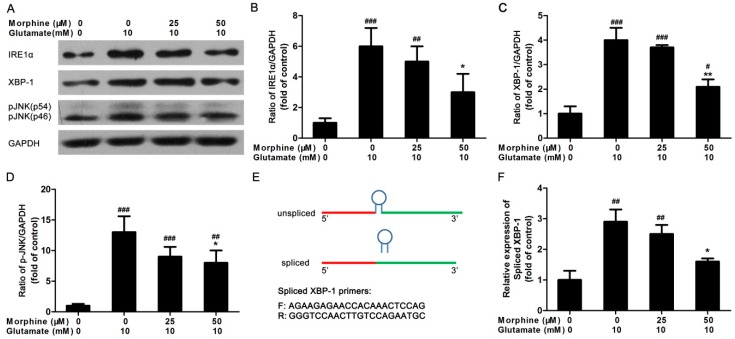
Figure 3.
The effect of morphine on IRE1 pathway in glutamate-treated astrocytes. (A) Following 24 h treatment, the cells were lysed and the protein were extracted to detect the expression of IRE1α, XBP-1, and phosphorylated JNK (p-JNK), GAPDH was internal control, blots were representative of three independent experiments; The optical density of each band was analyzed as (B) ratio of IRE1α/GAPDH, (C) ratio of XBP-1/GAPDH, (D) ratio of p-JNK/GAPDH, * p < 0.05, ** p < 0.01, compared to glutamate only treated group, # p < 0.05, ## p < 0.01, ### p < 0.001 compared to morphine only treated group, n = 3; (E) the schematic of XBP-1 mRNA splicing and the sequence of primers for spliced XBP-1 mRNA used in experiment; (F) following 24 h treatment, the cells were lysed and total mRNA was extracted. Then real-time PCR was performed to detect the mRNA expression of spliced XBP-1. * p < 0.05 compared to glutamate only treated group, ## p < 0.01 compared to morphine only treated group, n = 6.

