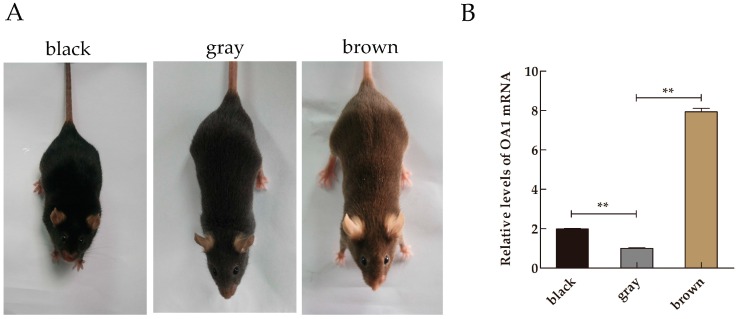
Figure 1.
The ocular albinism type 1 (OA1) mRNA analysis. (A) Photographs of C57BL/6J mice with a variety of coat colors; (B) Relative expression levels of OA1 mRNA in the mice skin samples of different coat colors. The abundance of OA1 was normalized relative to the abundance of β-actin. Data are shown as the mean ± standard errors (n = 3 each), ** p < 0.01.

