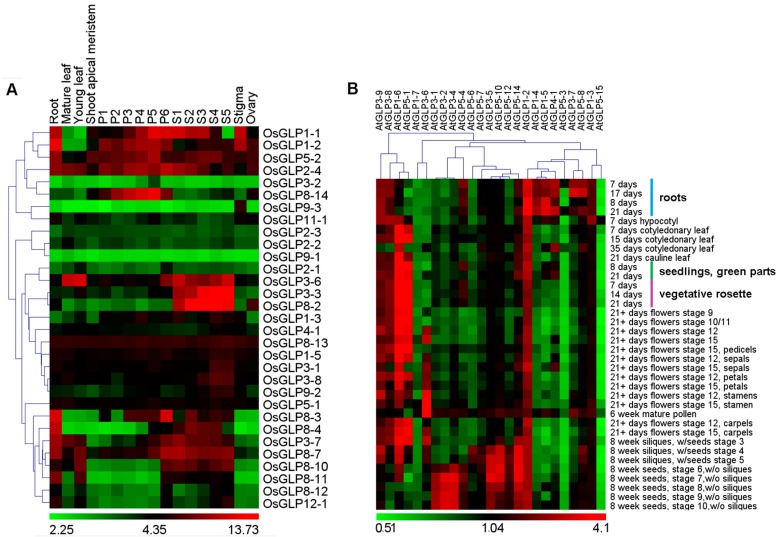
Figure 3.
Expression patterns of rice and Arabidopsis GLP genes in various tissues/organs and developmental stages. Hierarchical clustering analysis of 31 OsGLP genes (A) and 25 AtGLP genes (B) represented on an Affymetrix genome array is shown. Reproductive development comprising six stages of panicle (P1 (0–3 cm), P2 (3–5 cm), P3 (5–10 cm), P4 (10–15 cm), P5 (15–22 cm), and P6 (22–30 cm)) and five stages of seed tagged from day of pollination (S1 (0–2 DAP), S2 (3–4 DAP), S3 (5–10 DAP), S4 (11–20 DAP), and S5 (21–29 DAP)) development. For clustering we used average log signal values (log10 for Arabidopsis and log2 for rice) for three biological replicates of each sample after normalisation of raw data (Tables S2 and S3). The colour scale for log signal values is shown at the bottom.

