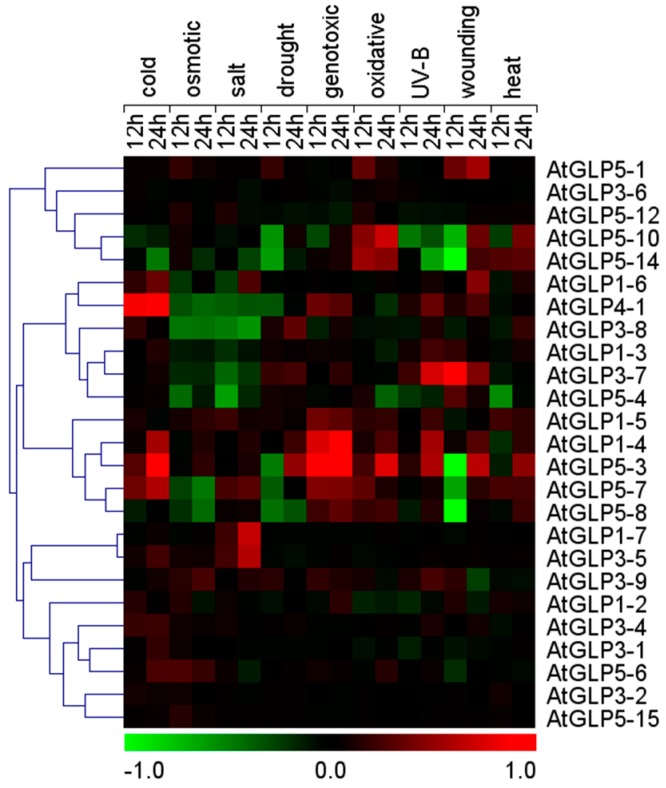
Figure 5.
Microarray-based expression profile of Arabidopsis GLP genes under various abiotic stress conditions. Heat maps show the log10 fold changes of Arabidopsis GLP gene expressions in root tissues under different abiotic stress conditions such as salt, drought, osmotic, cold, heat, oxidative, genotoxic, wounding, and UV/B stress. Microarray data (Table S7) was obtained for different time points and stresses viz. 12 and 24 h for root tissues and analysed with respect to the control. Relative signal values are represented by the colour bar shown at the bottom of heat map; green colour represents downregulation, black signifies no change in expression, and red shows up-regulation.

