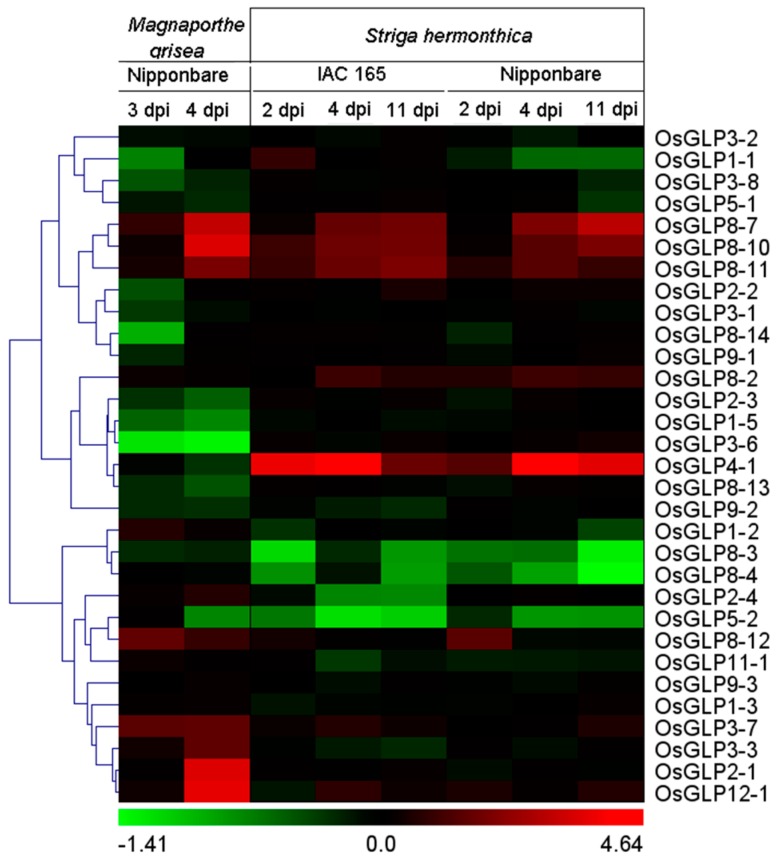
Figure 6.
Differential expressions of rice GLP genes in response to various biotic stress conditions. Hierarchical clustering of GLP genes showing significant differential expressions in at least one condition is shown. The log2 fold change of GLP gene expressions (Table S8) in treated sample compared with a mock-treated control sample was used for clustering. The colour scale for log2 fold change values is shown at the bottom. The green colour represents downregulation, black signifies no change in expression, and red shows upregulation. Dpi, days of post-inoculation.

