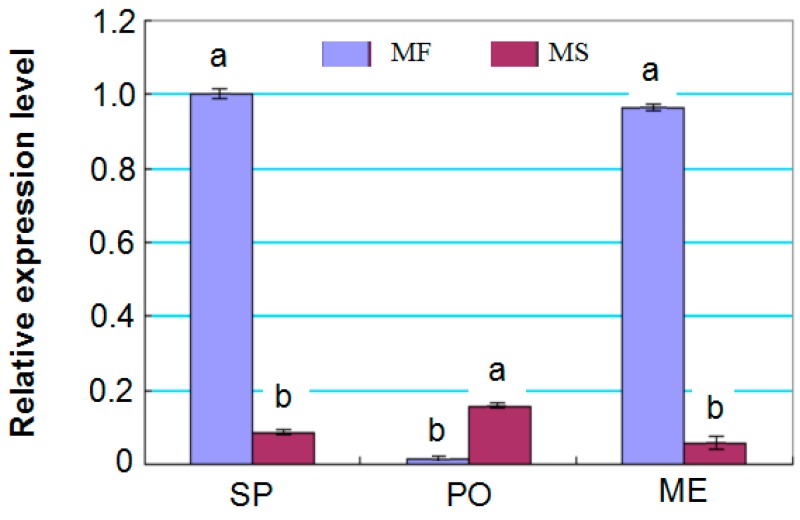
Figure 7.
Expression pattern analysis of miRNA5658 of MS and MF young buds by RT-qPCR. Relative expression was calculated by normalizing to the level of the 5S rRNA coding gene in RT-qPCR. SP, PO and ME represent the sporogenous cell, pollen mother cell formation and meiosis stages, respectively. Bars represent means + standard deviations, which were derived from three biological replicates (n = 3), and different letters above the bar indicate a significant differences at p < 0.05.

