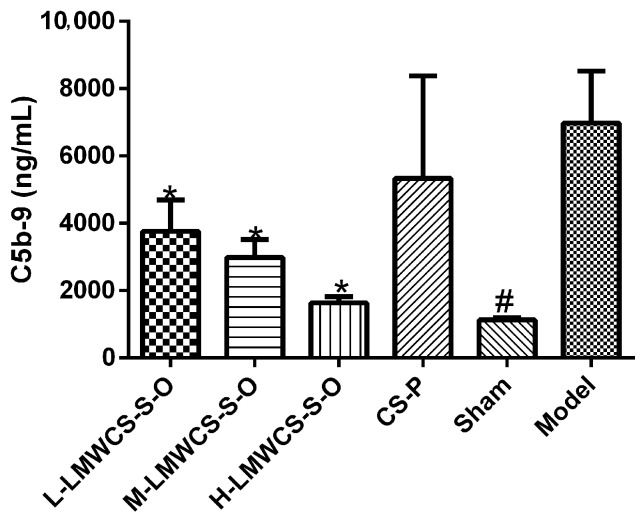
Figure 8.
C5b-9 levels of all mice administered with LMWCS-S-O and CS-P. The L-LMWCS-S-O, M-LMWCS-S-O and H-LMWCS-S-O groups were administered with 50, 150 and 450 mg/kg of LMWCS-S-O, respectively. The CS-P group was administered with 150 mg/kg of CS-P. The sham and model groups were administered with saline. Bar graphs present n ≥ 5. * p < 0.05 vs. the model; # p < 0.05 vs. the model.

