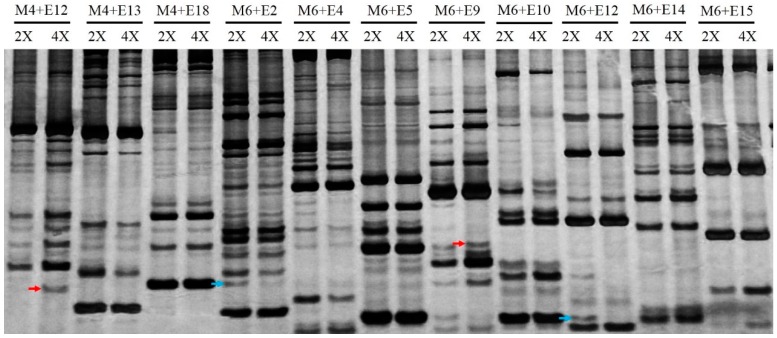
Figure 2.
DNA-SRAP profiling of diploid and tetraploid of C. lavandulifolium: Upper panel represents primer combinations. 2X indicates diploid, and 4X indicates tetraploid. “→” to red arrows represents novel bands and blue arrows represent lost bands in the tetraploid. E# represents the em# primer, M# indicates me# primers. Bands detected range from 100 to 500 bp.

