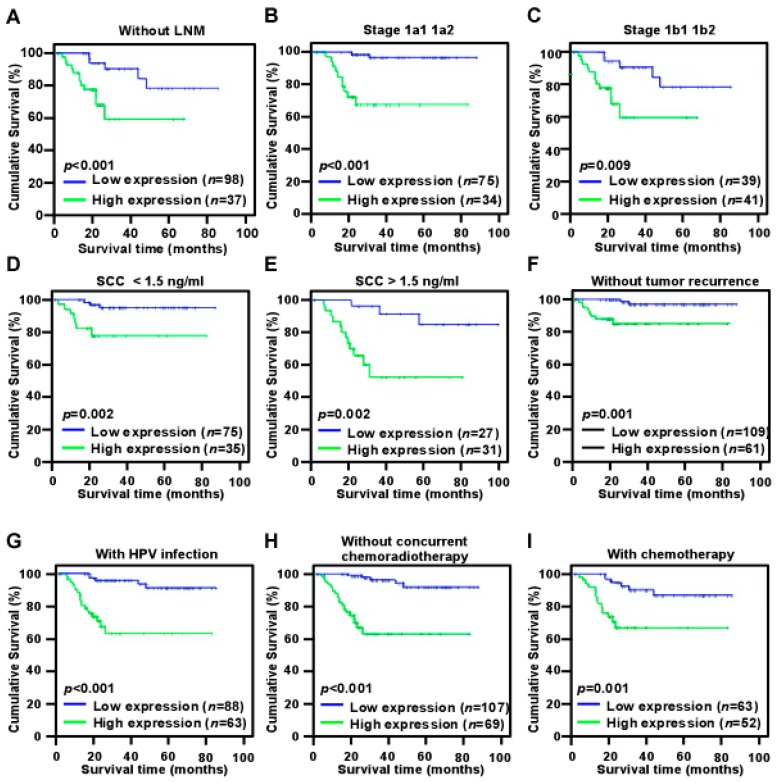
Figure 4.
Kaplan–Meier curves of univariate analysis data (log-rank test) of patients with high versus low NR2F6 expression. (A) OS of LNM-free patients; (B) OS of patients with stage IIA1–IIA2 disease; (C) OS of patients with stage IB1–IB2 disease with high versus low NR2F6 expression; (D) OS of patients with SCC (squamous cell carcinoma antigen) antigen <1.5 ng/mL; (E) OS of patients with SCC antigen >1.5 ng/mL; (F) OS of patients without recurrence; (G) OS of patients with HPV infection; (H) OS of patients without CCRT (concurrent chemoradiotherapy); (I) OS of patients who received chemotherapy.

