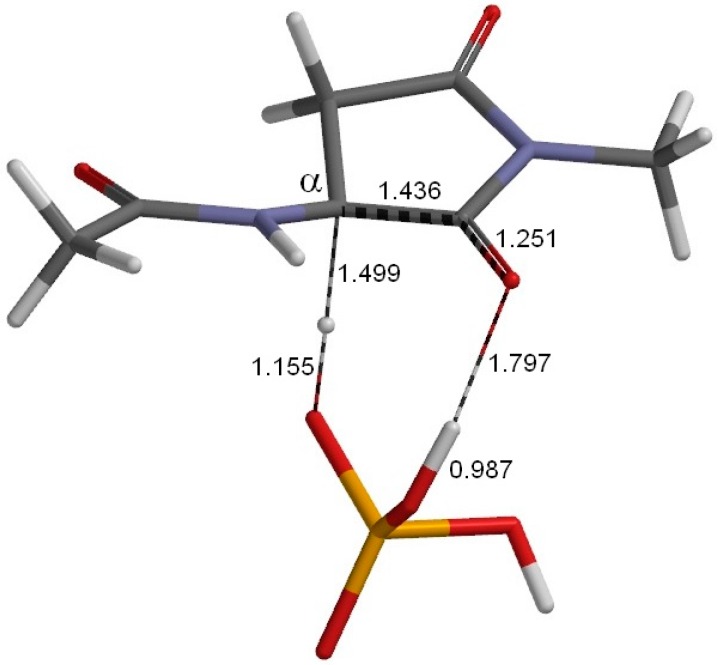
Figure 4.
The geometry of the first transition state TS1 (φ = 178°, ψ = −150°, χ1 = 146°). This transition state is for enolization and connects RC (Figure 3) and EN1 (Figure 5). Selected interatomic distances are shown in Å. The imaginary frequency of this transition state is 856i cm−1. Grey: carbon; white: hydrogen; blue: nitrogen; red: oxygen; orange: phosphorus.

